2013-2014 APR Snapshot #10:
Martha Thurlow and Yi-Chen Wu August, 2016 All rights reserved. Any or all portions of this document may be reproduced and distributed without prior permission, provided the source is cited as: Thurlow, M. L., & Wu, Y.-C. (2016). 2013-2014 APR snapshot #10: State assessment participation and performance of students receiving special education services. Minneapolis, MN: University of Minnesota, National Center on Educational Outcomes. Table of Contents
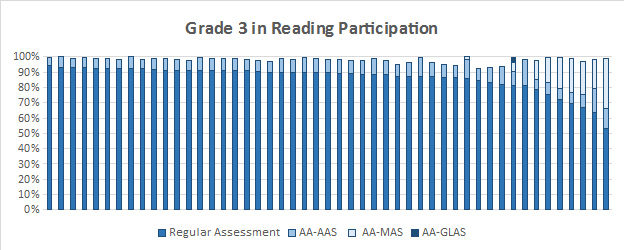
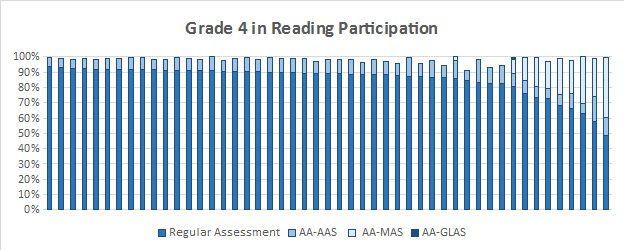
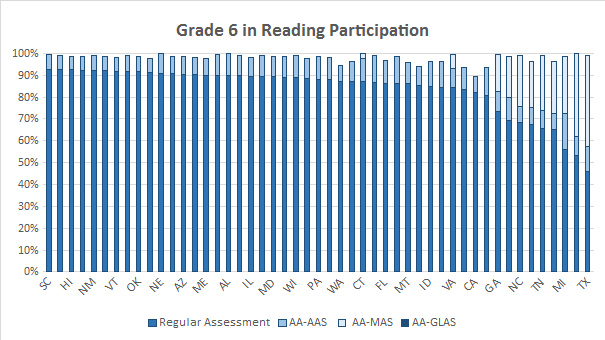
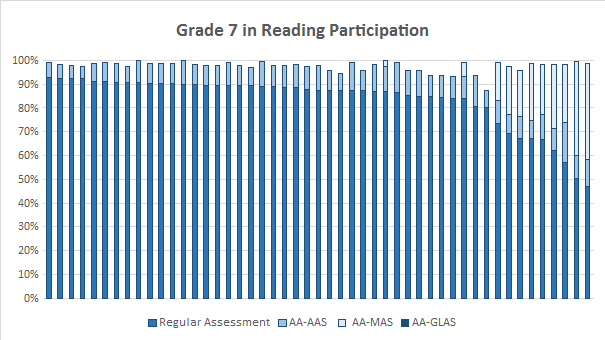
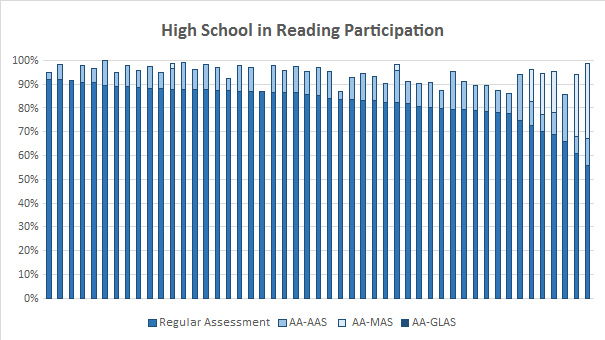
BackgroundThis brief provides a snapshot of the participation and performance of student receiving special education services in statewide assessments used for Elementary and Secondary Education Act (ESEA) accountability. Using federally submitted data from the 2013-14 school year, we present information on participation and performance in reading and mathematics statewide assessments administered to grade 8 students. Many states were field-testing their assessments in 2013-14. States provided both field test data and non-field test data. Participation rates in this brief were calculated using data from both field-test and non-field-test assessments. Proficiency rates in this brief were calculated using only non-field test data because performance results were not available for field tests. Figures displaying statewide assessment data for other grades are provided in this report following each figure. Data tables for all grade levels are available at nceo.info/Resources/publications/APRsnapshot/data. Throughout this brief, we use the term “students with disabilities” to refer to students receiving special education services. Thus, students on 504 accommodation plans are not included in these analyses. Top of page | Table of Contents FindingsParticipation in ReadingOverall participation of students with disabilities in statewide grade 8 reading assessments in the regular states is presented in Figure 1. In this figure, one of the 50 states is missing because it did not report data for the regular assessment. Students with disabilities may participate in the regular assessment or in assessments designated for students receiving special education services only. In 2013-14, the other assessments included the alternate assessment based on alternate achievement standards (AA-AAS), the alternate assessment based on modified achievement standards (AA-MAS), and the alternate assessment based on grade-level achievement standards (AA-GLAS). Total participation rates of students with disabilities (across all assessments) were typically 90% or higher across all 49 regular states, with the average participation rate being 97.1%. The percentages of students with disabilities participating in other statewide assessments (AA-AAS, AA-MAS, and AA-GLAS) varied dramatically, resulting in different rates of participation in the regular assessment. The AA-AAS for students with significant cognitive disabilities was available in 49 states. The participation rate in the AA-AAS varied from 4.2% to 16.7% of students with disabilities. The average rate across states was 9.0% of students with disabilities. Those states with an active AA-MAS generally reported testing fewer students with disabilities on the regular assessment. In those states with an AA-MAS, between 2.1% and 44.8% of students with disabilities participated in the AA-MAS. Two states reported testing students on an AA-GLAS. The percentages of students in this assessment were relatively small, with one state having a participation rate of 0.1%, and the other 0.01% of all grade 8 students with disabilities. In most states, the test that is taken by the majority of students with disabilities is the regular assessment. Still, with their participation in other assessments, the participation rates of students with disabilities in the regular assessment varied from 45.3% to 94.6%. An average of 82.9% of students with disabilities participated in the regular grade 8 reading assessments in 2013-14. The average participation rate was higher at lower grade levels and lower at higher grade levels. Figure 1. 2013-14 Participation Rates for Eighth Grade Students with Disabilities in Reading Assessments for Regular States
Grades 3 - 7 and High School Reading. Click the images to enlarge.
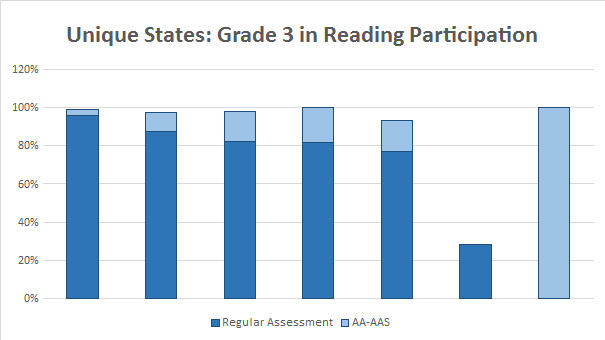
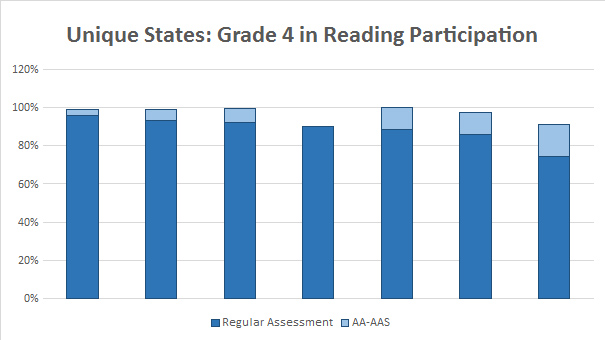
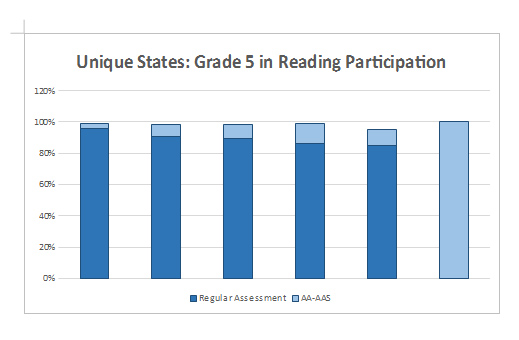
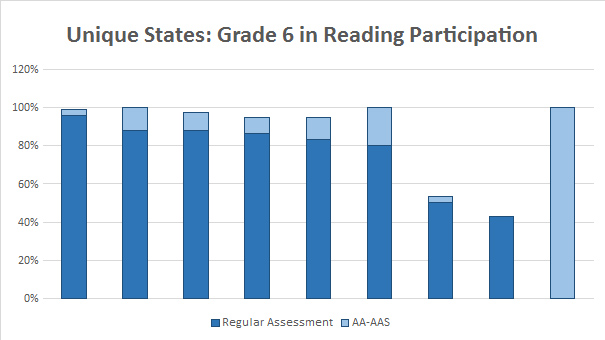
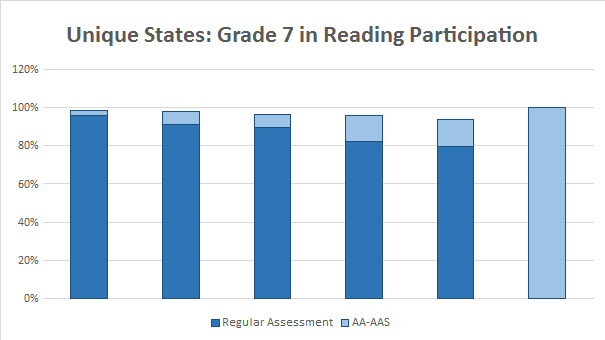
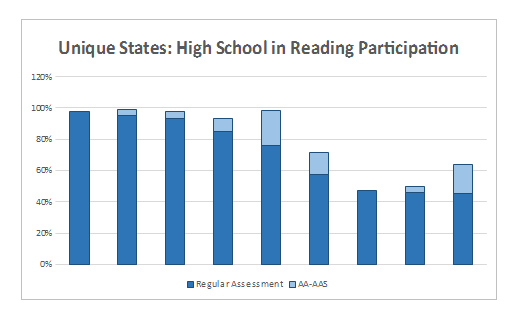
Overall participation rates of students with disabilities in grade 8 reading assessments (across all assessments) in unique states that reported data (n=9) varied from 58.4% to 98.4% (see data available at nceo.info/Resources/publications/APRsnapshot/data.). No unique state reported data for an AA-MAS or AA-GLAS assessment, indicating that the overall participation rates are based on the regular assessment and the AA-AAS. Participation rates for the AA-AAS in the unique states varied from 0.0% to 9.8% of students with disabilities. Regular assessment participation made up the bulk of the assessment activity for students with disabilities in the unique states. These states reported a range of 54.7% to 95.0% participation in the regular assessment at the 8th grade level. Figure 2. 2013-14 Participation Rates for Eighth Grade Students with Disabilities in Reading Assessments for Unique States
Grades 3 - 7 and High School Reading. Click the images to enlarge.
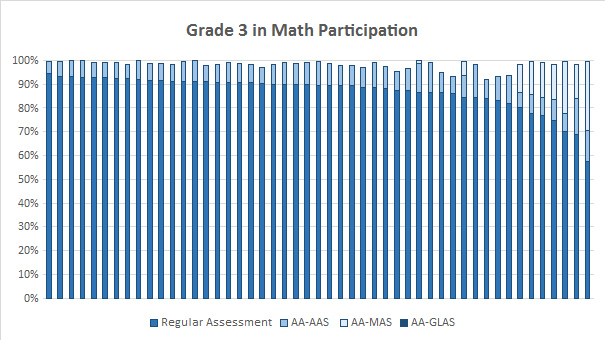
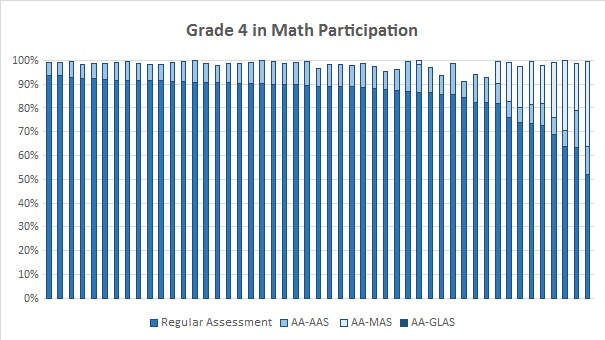
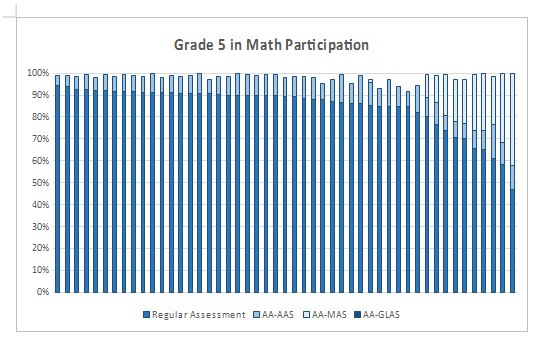
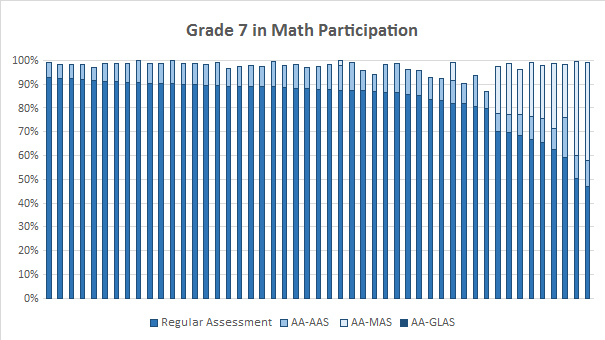
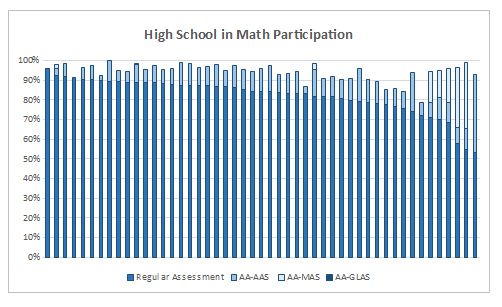
Participation in MathematicsOverall participation of students with disabilities in statewide grade 8 mathematics assessments in the regular states is presented in Figure 3. In this figure, one of the 50 states is missing because it did not report regular assessment data. Total participation rates for students with disabilities (across all assessments) were typically 90% or higher across the 49 regular states, with the average participation rate being 97.0%. The percentages of students with disabilities participating in other statewide assessments (AA-AAS, AA-MAS, and AA-GLAS) varied dramatically, resulting in different rates of participation in the regular assessment. States tested an average of 9.2% of students with disabilities on an AA-AAS. The range across states was from 4.3% to 16.9%. Those regular states with an active AA-MAS reported testing between 2.1% and 45.2% of students with disabilities on the AA-MAS. These states tended to have fewer students participating in the regular assessment. One state reported testing students on an AA-GLAS with a participation rate of 0.01% of all grade 8 students with disabilities. In most states, the test taken by the majority of students with disabilities was the regular assessment. An average of 82.5% of students with disabilities across the 49 states with these data participated in this assessment. The range in participation was from 44.8% to 94.6%. Figure 3. 2013-14 Participation Rates for Eighth Grade Students with Disabilities on Mathematics Assessments for Regular States
Grades 3 - 7 and High School Mathematics. Click the images to enlarge.
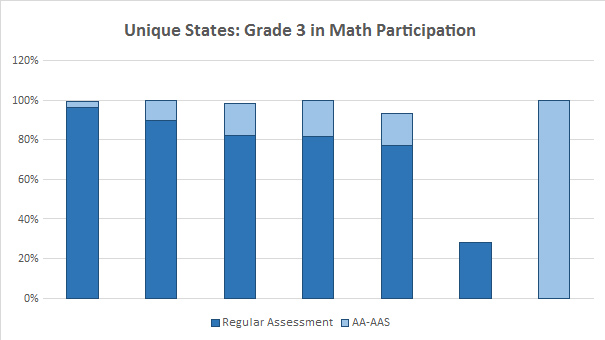
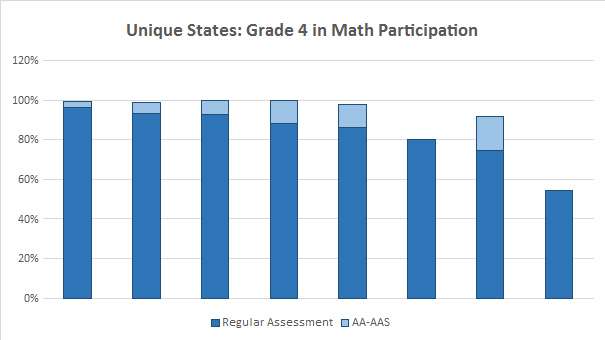
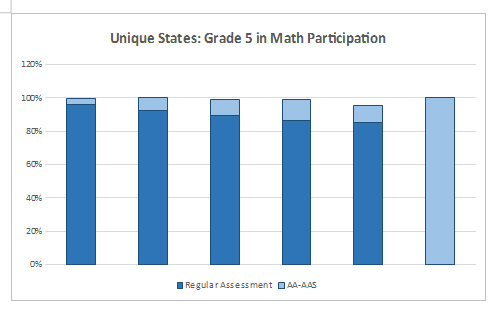
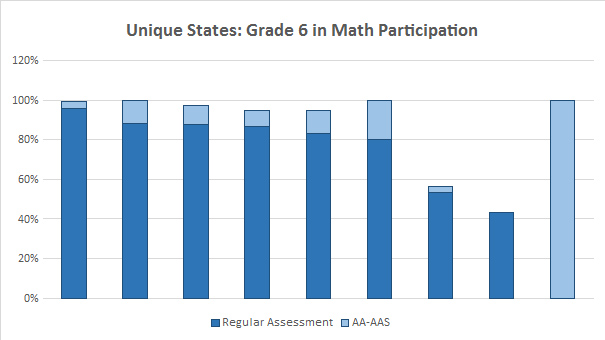
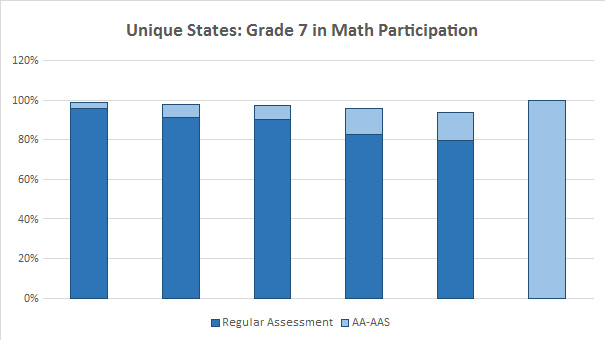
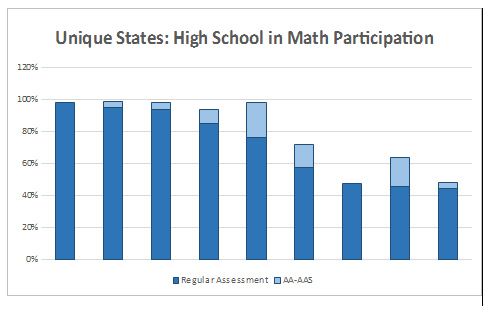
Overall participation rates of students with disabilities in grade 8 mathematics assessments (across all assessments) in unique states (n=9) that reported data varied from 58.6% to 98.6% (see data available at nceo.info/Resources/publications/APRsnapshot/data.). No unique state reported data for an AA-MAS or AA-GLAS assessment. Participation rates for the AA-AAS at the 8th grade level in unique states ranged from 0.0% to 9.8%. Regular assessment participation made up the bulk of the assessment activity for students with disabilities in the unique states. These states reported a range of 54.9% to 95.2% participation in the regular assessment at the 8th grade level. Figure 4. 2013-14 Participation Rates for Eighth Grade Students with Disabilities in Mathematics Assessments for Unique States
Grades 3 - 7 and High School Mathematics. Click the images to enlarge.
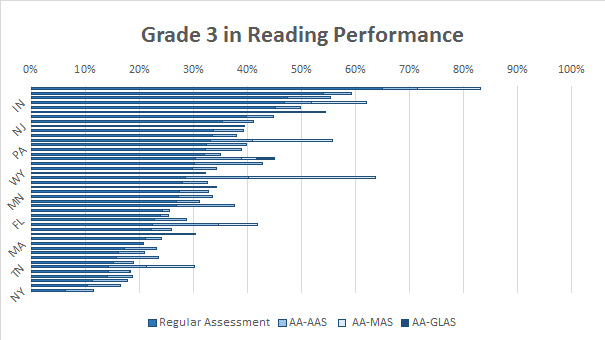
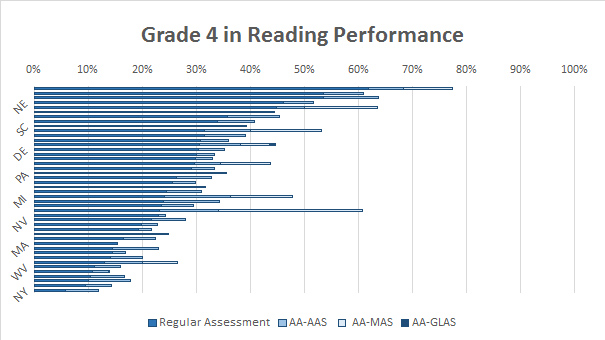
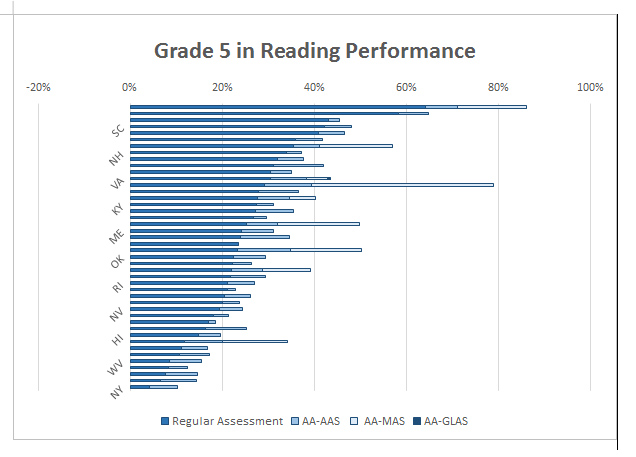
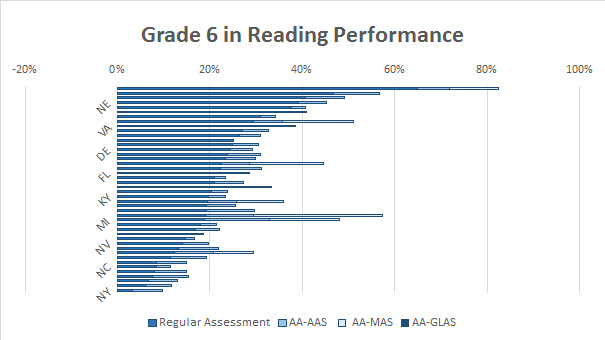
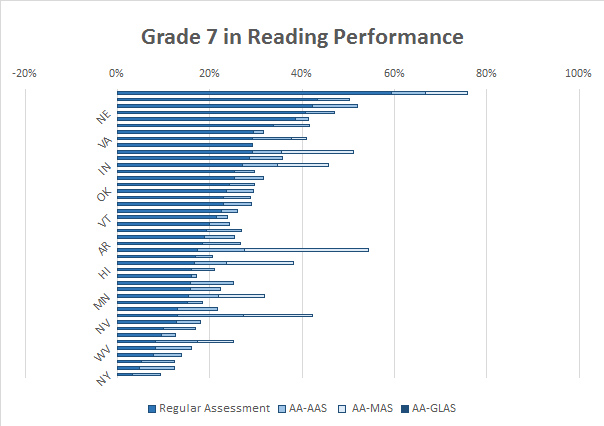
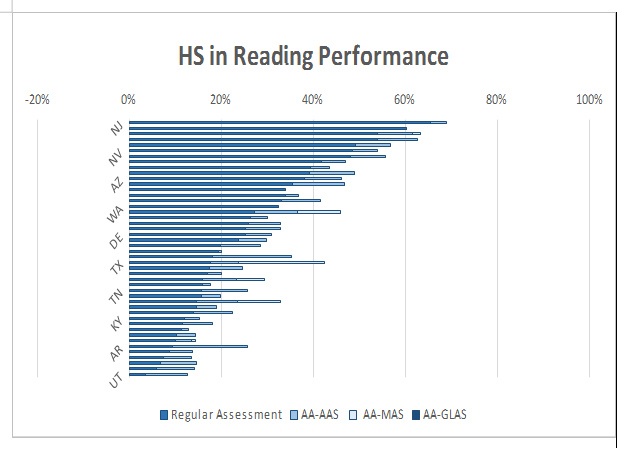
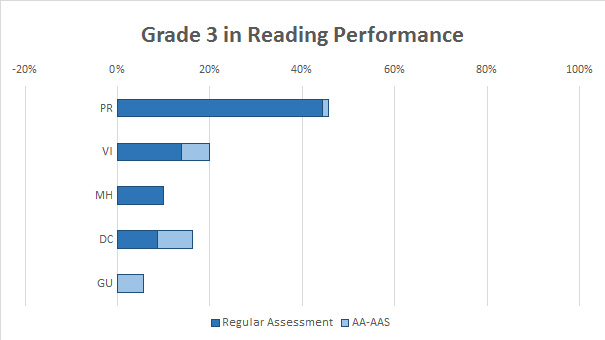
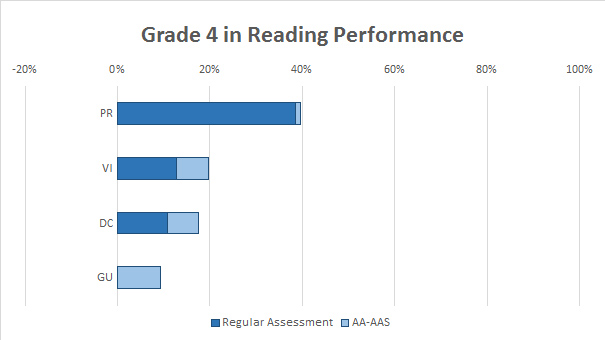
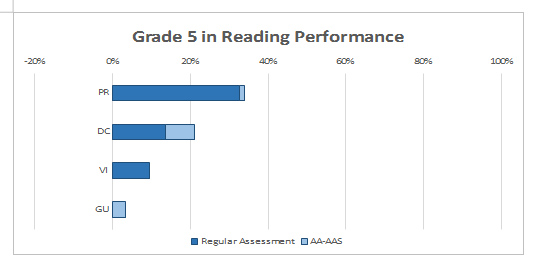
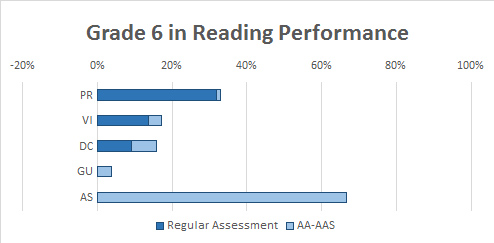
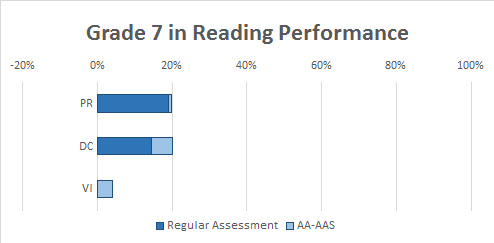
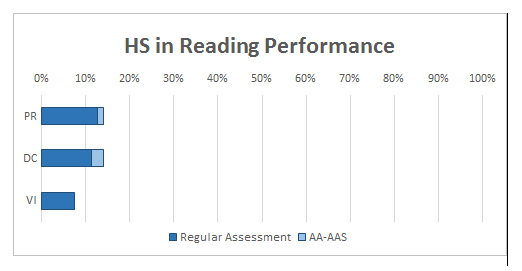
Proficiency in ReadingThe percentage of students with disabilities who scored at a proficient or above level was much more variable than participation rates across the 50 regular states that had data available for their regular reading assessment in 2013-14. Six states did not have information on proficiency rates because one state did not report data for the regular assessment and the other five states were missing proficiency information due to their participation in field tests during 2013-14. Overall proficiency rates for students with disabilities in grade 8 (across all reading assessments) ranged from 9.7% to 85.0% (see Figure 5, with states ordered according to the percentage proficient and above on the regular assessment). The average grade 8 proficiency rate across all reading assessments was 30.2%. Ten states reported overall proficiency rates of more than 40%; three of these states reported total proficiency of 50% or more. Five of these 10 states included proficient scores from an AA-MAS in their overall proficiency rate. For students with disabilities participating in the AA-AAS, between 1.8% and 14.5% were proficient or above on the AA-AAS across the 44 states with complete data (based on all students with disabilities, not just those participating in the AA-AAS). The average percentage of students taking the AA-AAS who were proficient and above was 6.2%. Ten states that reported participation numbers for the AA-MAS also reported on the number of students with disabilities who were at or above the proficient level on that assessment. Between .04% and 33.2% (based on all students with disabilities) were proficient or above in reading on the AA-MAS in these states. The average proficiency rate on the AA-MAS for students with disabilities in these states was 11.7%. For students with disabilities participating in the AA-GLAS (in the two states that offered this assessment), only one state reported a proficiency rate, with it being 0.1%. Proficiency rates on the regular assessment varied from 4.0% to 64.0%. An average of 21.4% of students with disabilities were at or above the proficient level on regular grade 8 assessments in 2013-14. Figure 5. 2013-14 Performance Trends for Eighth Grade Students with Disabilities on Reading Assessments for Regular States
Grades 3 - 7 and High School Reading. Click the images to enlarge.
Overall proficiency rates in unique states (n=4) that reported 2013-14 assessment data varied from 6.6% to 19.8% (see data available at nceo.info/Resources/publications/APRsnapshot/data.). No unique state reported data for an AA-MAS or AA-GLAS assessment. Two unique states reported proficiency rates for the AA-AAS. One unique state reported a rate of 1.1% proficient and the other reported 7.0% (based on all students with disabilities, not just those in the AA-AAS). Proficiency on the regular assessment made up the bulk of the overall proficiency rate for students with disabilities in the unique states. These states reported a range of 6.6% to 18.7% proficient on the regular assessment. Figure 6. 2013-14 Performance Trends for Eighth Grade Students with Disabilities on Reading Assessments for Unique States
Grades 3 - 7 and High School Reading. Click the images to enlarge.
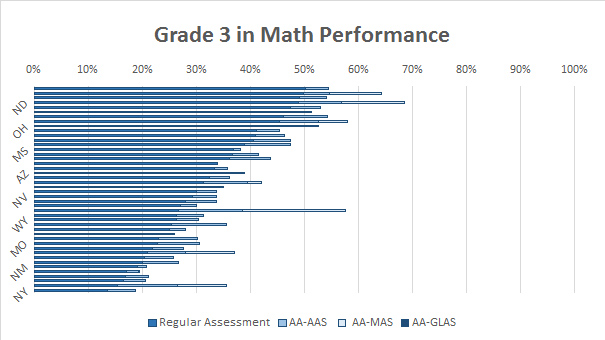
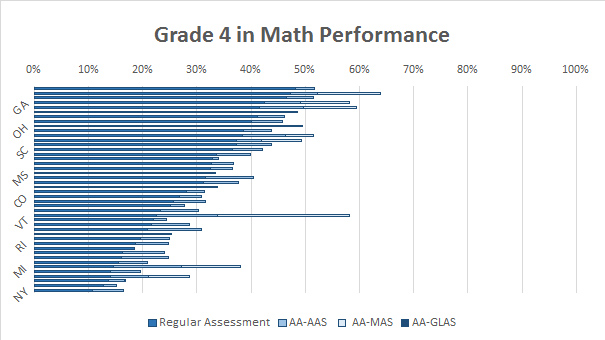
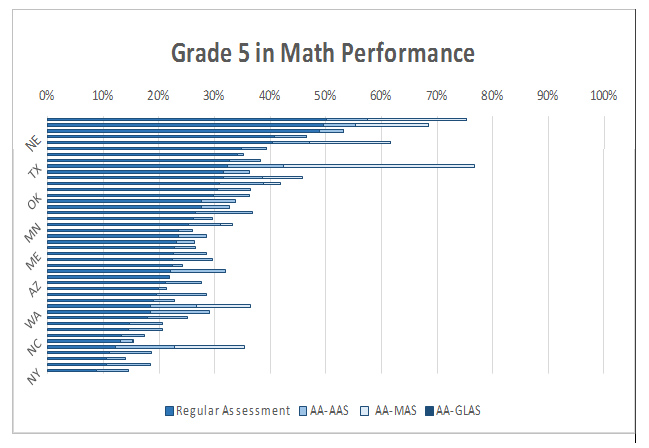
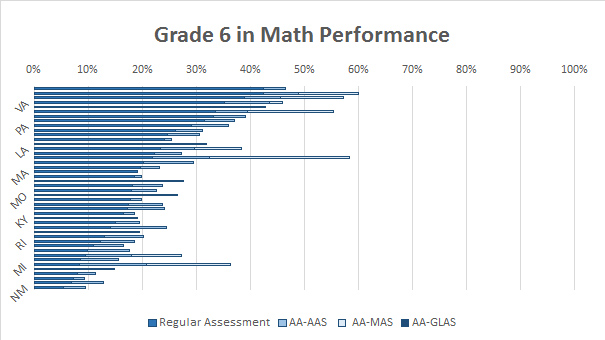
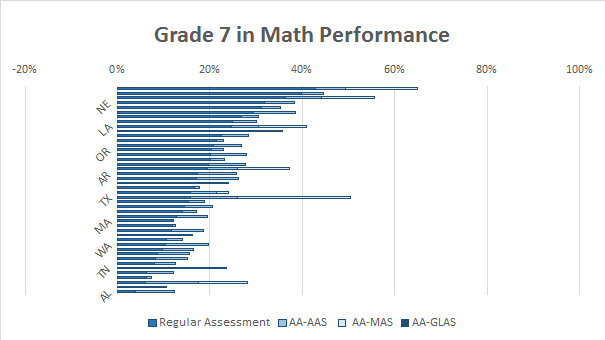
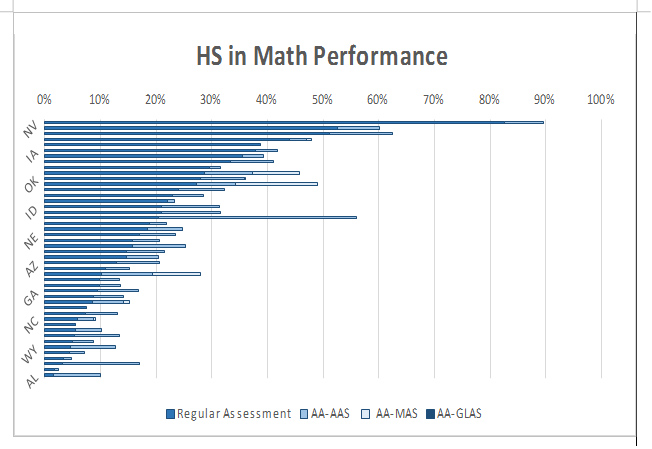
Proficiency in MathematicsOverall proficiency rates for students with disabilities in grade 8 (across all mathematics assessments) in the regular states were generally lower than proficiency rates for reading. Figure 7 shows these rates for states ordered according to the percentage of students with disabilities proficient and above on the regular assessment. Six states are missing from this figure because one state did not report data for the regular assessment; the other five states were missing proficiency information due to their participation in field-tests. Proficiency rates ranged from 6.3% to 72.4%, with the average across all states being 24.3%. Ten states reported overall proficiency rates of more than 30% and three states reported total proficiency rates of more than 50%. These three states all had included proficient scores for an AA-MAS. For students with disabilities participating in the AA-AAS, between 0.8% and 13.0% were proficient or above on the AA-AAS across the 44 states with complete data (based on all students with disabilities, not just those participating in the AA-AAS). The average percentage of students taking the AA-AAS who were proficient and above was 6.0%. Ten states that reported participation numbers for the AA-MAS also reported on the number of students with disabilities who were at or above the proficient level on that assessment. Between 0.1% and 33.1% (based on all students with disabilities) were proficient or above in mathematics on the AA-MAS in these states. The average proficiency rate on this assessment was 9.2%. The one state that reported a participation rate for the mathematics AA-GLAS did not report performance data. Proficiency rates on the regular assessment varied from 2.8% to 39.7%. An average of 16.4% of students with disabilities were at or above the proficient level on regular grade 8 assessments in 2013-14. Figure 7. 2013-14 Performance Trends for Eighth Grade Students with Disabilities on Mathematics Assessments for Regular States
Grades 3 - 7 and High School Mathematics. Click the images to enlarge.
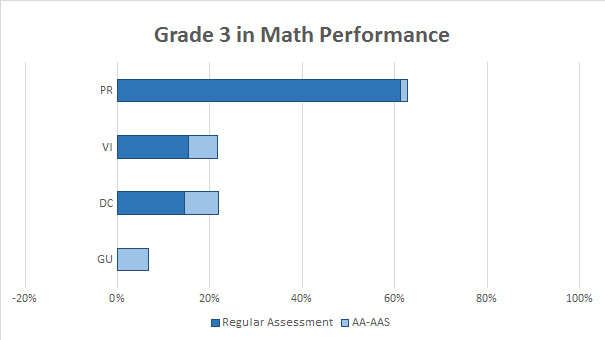
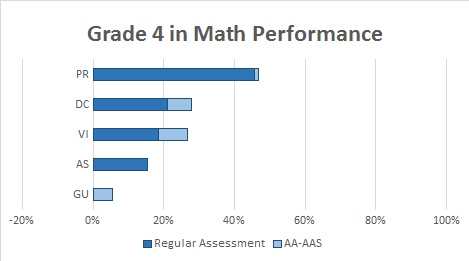
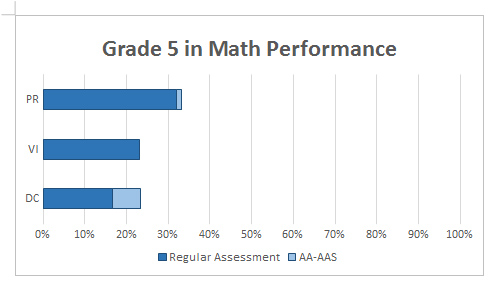
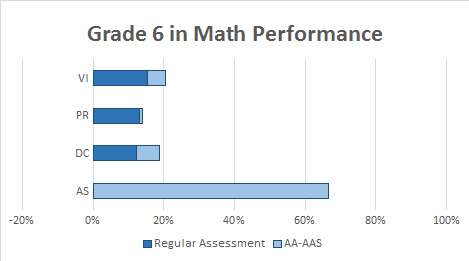
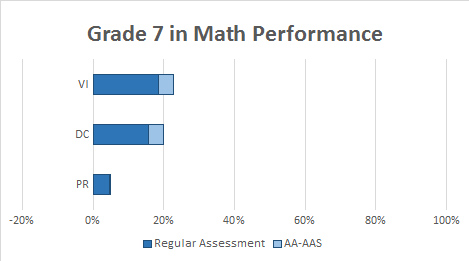
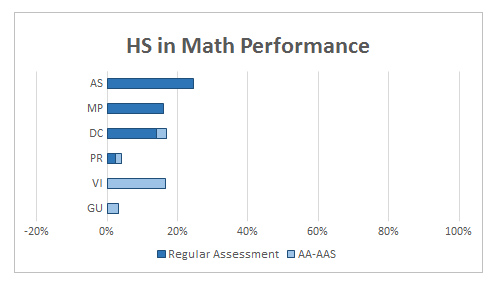
Overall proficiency rates in unique states (n=5) that reported 2013-14 mathematics assessment data varied from 5.9% to 32.8% (see data available at nceo.info/Resources/publications/APRsnapshot/data.). No unique state reported data for the AA-MAS or the AA-GLAS. Only two states reported proficiency rates for mathematics at grade 8 on the AA-AAS. One unique state reported a proficient or above rate of 1.1% and the other reported a rate of 6.4% (based on all students with disabilities, not only those taking the AA-AAS). Five unique states reported proficiency rates on their regular assessments in grade 8. These ranged from 4.8% to 32.8% (based on all students with disabilities). The average rate was 17.1%. Figure 8. 2013-14 Performance Trends for Eighth Grade Students with Disabilities on Mathematics Assessments for Unique States
Grades 3 - 7 and High School Mathematics. Click the images to enlarge.
Top of page | Table of Contents ConclusionsThe data presented in this report represent a snapshot of the participation and performance of students receiving special education services on their states’ reading and mathematics assessments for the 49 regular states and 9 unique states with participation data available for analysis and 44 regular states and 5 unique states with proficiency data available for analysis. Variability identified in participation and performance rates reflects the differences in the state assessment systems themselves, including where the proficient cuts were set and whether alternate assessment options such as the AA-MAS and AA-GLAS were available for students with disabilities. In most of the regular states, students with disabilities at the earlier grade levels generally showed higher rates of proficiency on state mathematics assessments compared to their performance on state reading assessments. As grade level increases, more states’ students with disabilities showed higher proficiency rates in reading than in math. This same pattern was found in previous years (Vang & Thurlow, 2013, 2014) and also in the 2013 NAEP results (National Center for Education Statistics, n.d.). It is apparent from this snapshot of the participation and performance of students with disabilities that examining their performance levels is more complicated than it is for students not receiving special education services because the participation and performance data are not only from the regular assessment, but also from one or more alternate assessments. Students with disabilities are proficient in varying rates across the different assessments offered within states. In just looking at the regular assessment, it becomes apparent that the scores on this assessment are likely a major reason for that discrepancy (whereas performance on alternate assessments may be more consistent across content areas). This complexity is not necessarily reflected in public reports of participation and performance (Lazarus, Albus, & Thurlow, 2016). Top of page | Table of Contents ResourcesAltman, J., Vang, M., & Thurlow, M. (2012). 2008-2009 APR snapshot #1: State assessment participation and performance of special education students. Minneapolis, MN: University of Minnesota, National Center on Educational Outcomes. Lazarus, S. S., Albus, D., & Thurlow, M. L. (2016). 2013-14 publicly reported assessment results for students with disabilities and ELLs with disabilities (NCEO Report 401). Minneapolis, MN: University of Minnesota, National Center on Educational Outcomes. Vang, M., & Thurlow, M. (2013). 2010-2011 APR snapshot #4: State assessment participation and performance of students receiving special education services. Minneapolis, MN: University of Minnesota, National Center on Educational Outcomes. Vang, M., & Thurlow, M. (2014). 2011-2012 APR snapshot #7: State assessment participation and performance of students receiving special education services. Minneapolis, MN: University of Minnesota, National Center on Educational Outcomes. National Center for Education Statistics. (n.d.). 2013 Mathematics and reading. Retrieved April 07, 2016, from http://www.nationsreportcard.gov/reading_math_2013/#/state-performance |