2008-2009 APR Snapshot #2:
|
 |
 |
 |
 |
 |
 |
|
Grade 3 |
Grade 4 |
Grade 5 |
Grade 6 |
Grade 7 |
Grade HS |
Click the above images to enlarge graphs for Grades 3-7 and High School.
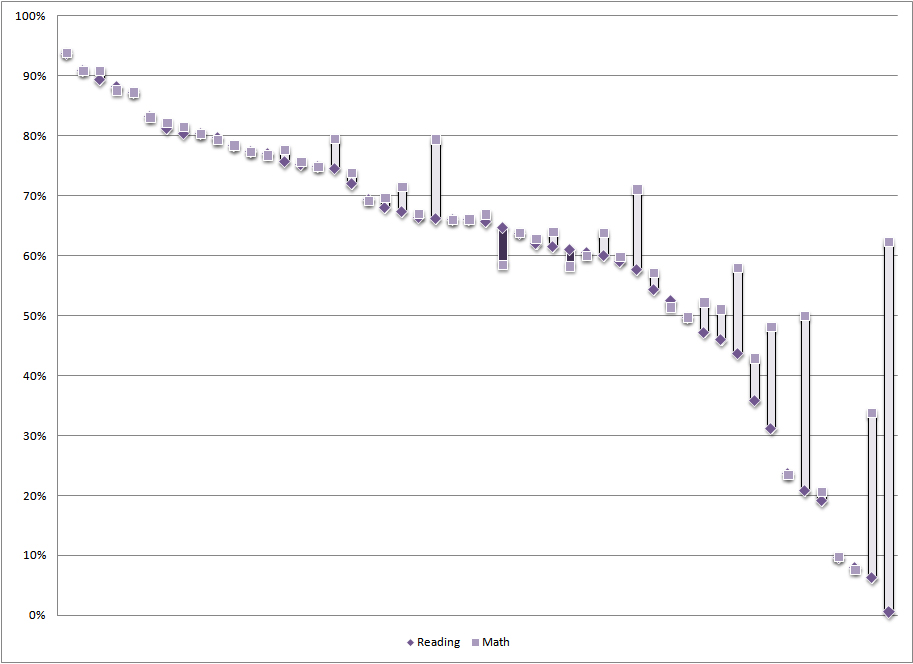
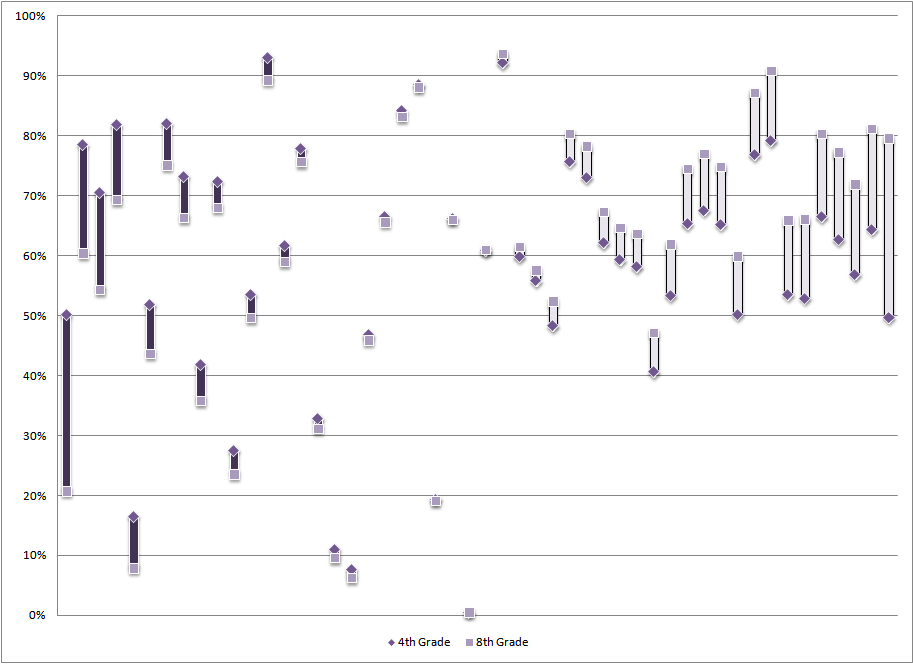
Accommodations Use in Grades 4 and 8
Figure 2 shows the percentage of special
education students using accommodations
during statewide reading assessments in
grade 4 and grade 8. The figure shows states
ordered by their grade 4 rates of students
using accommodations for the regular reading
assessment. The figure indicates visible
differences between the percentages of
special education students using
accommodations in the two grade levels. In
the 13 states with differences greater than
10 percentage points, 9 had lower
percentages of special education students
using reading accommodations in grade 4 than
in grade 8. The figure also shows that in 9
states, more than 75 percent of special
education students used accommodations
during the statewide reading assessment in
both grade 4 and grade 8; in 5 states, fewer
than one in four students used
accommodations during reading assessment in
grade 4 and grade 8 (see data available at
www.nceo.info/APRsnapshot/data).
Differences in accommodation rates in unique
states that reported data were as much as 8
percentage points of difference between
grade 4 and grade 8 data. These states are
not included in Figure 2, but are included
in data tables available at
http://nceo.info/APRsnapshot/data). Rates
for accommodations on the reading assessment
ranged from 36.4 percent to 100.0 percent
across grade 4 and grade 8 in unique states.
Figure 2. Percentage of Grade 8 and
Grade 4 Special Education Students Using
Accommodations in 2008-2009 Reading
Assessments
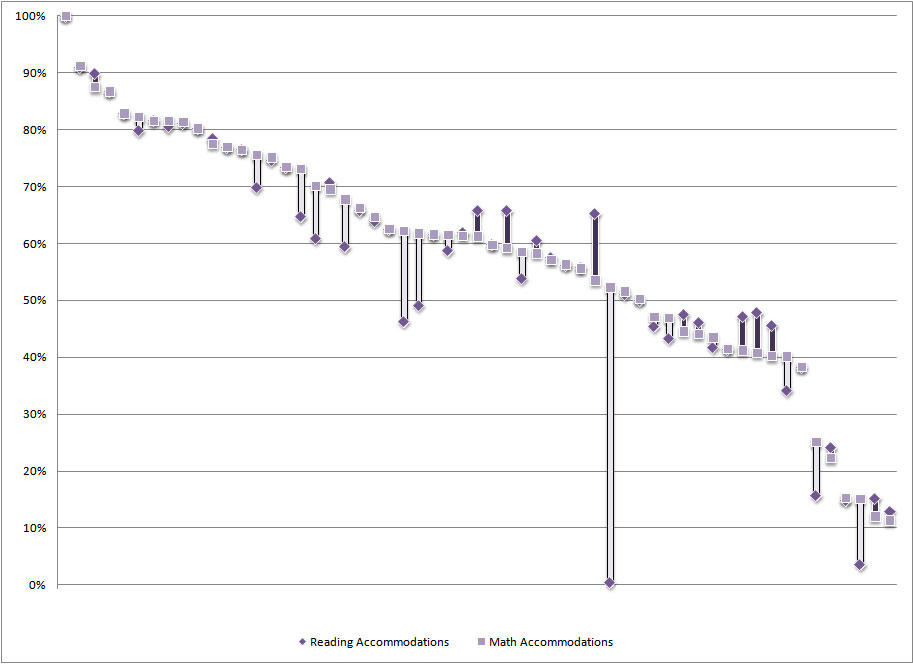
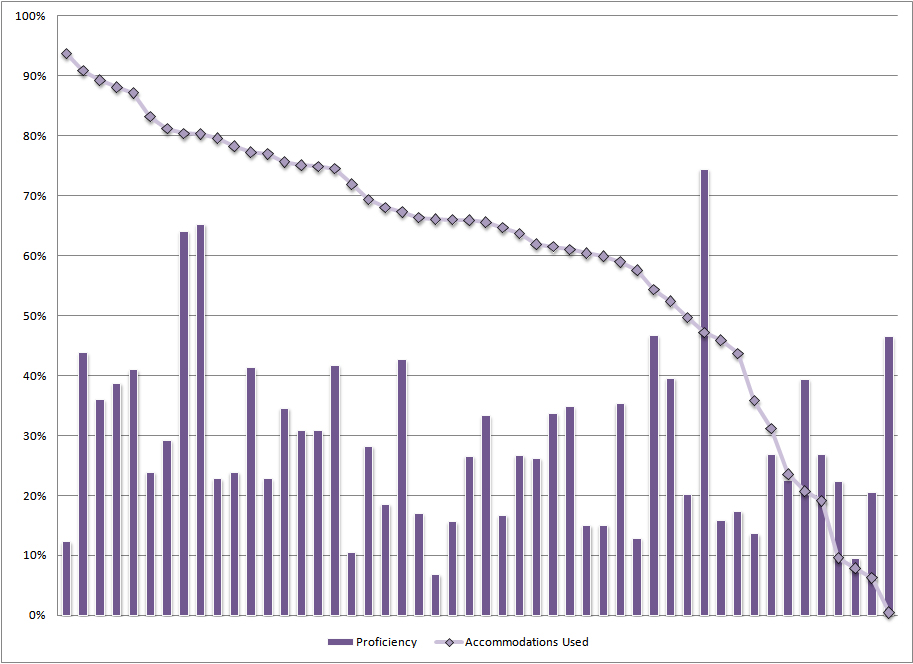
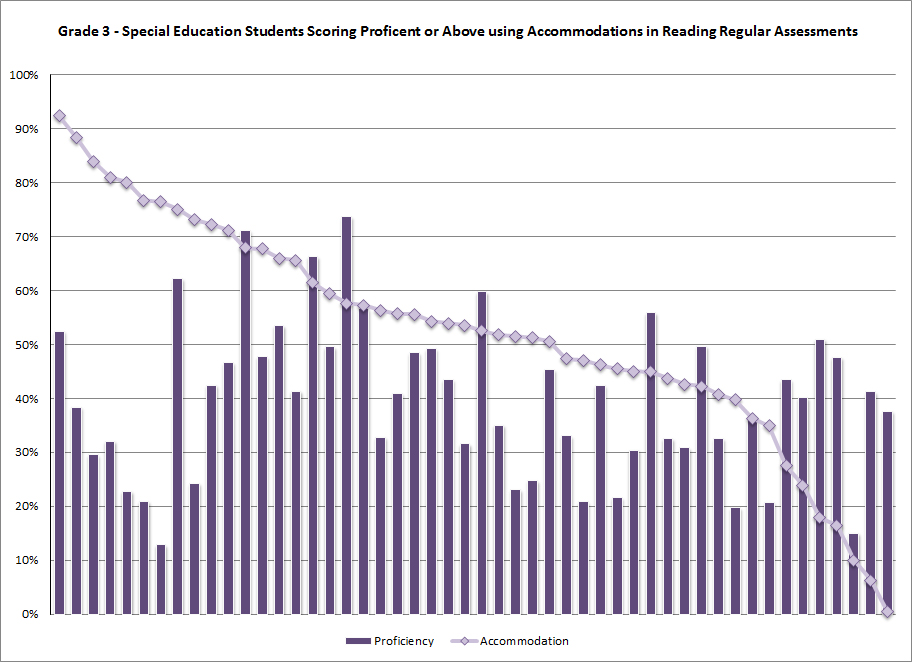
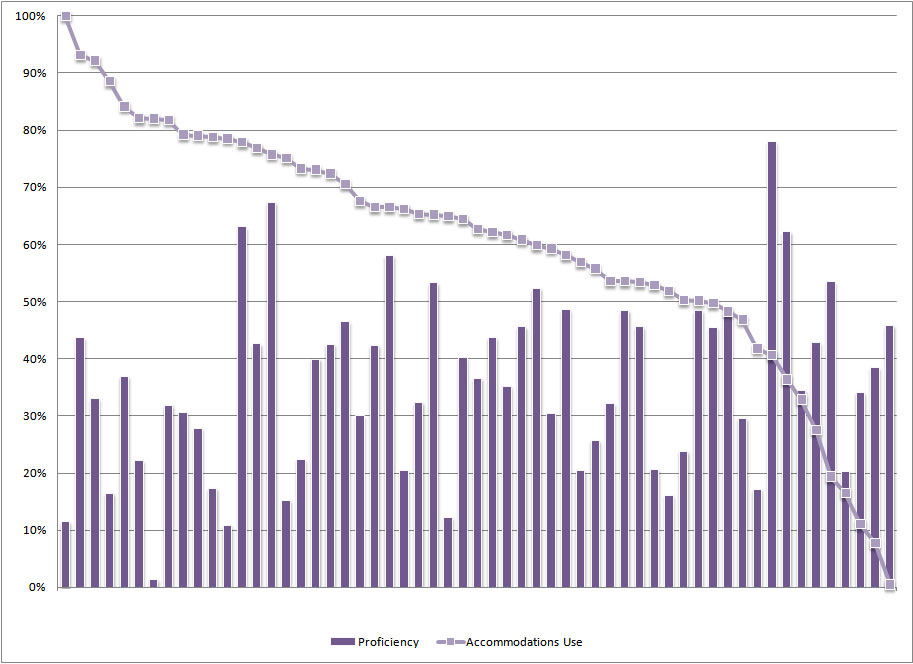
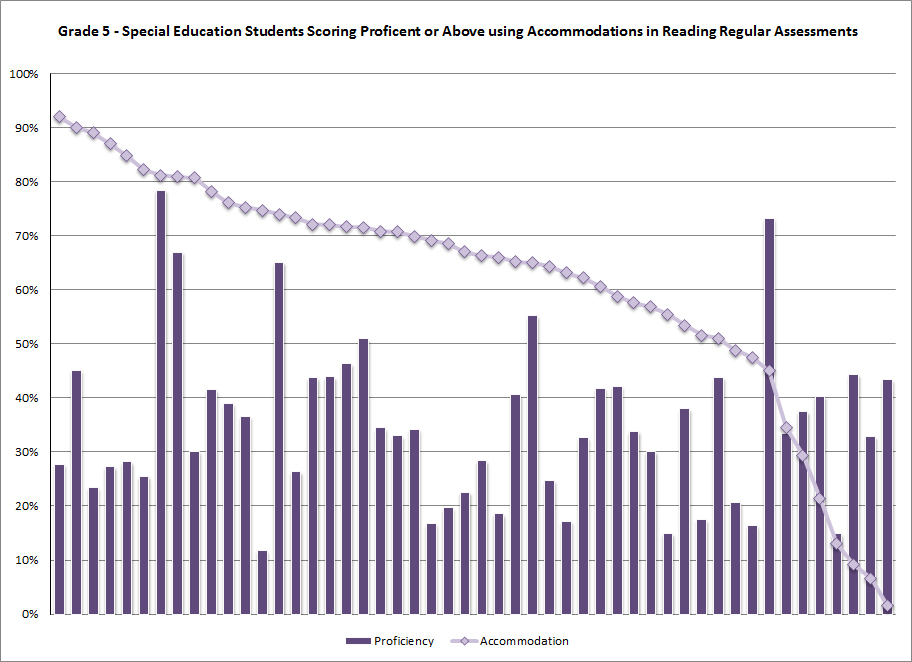
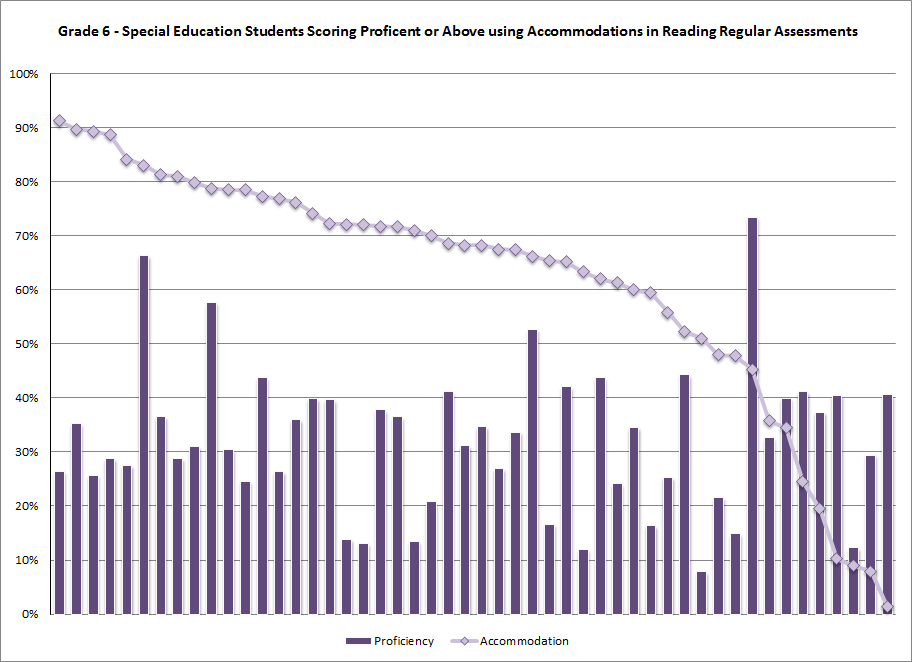
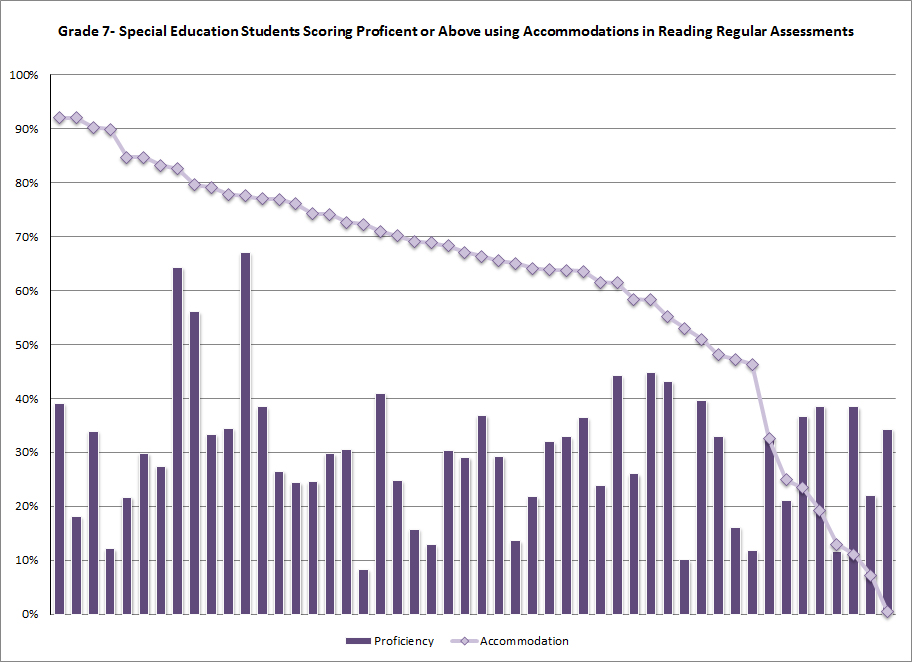
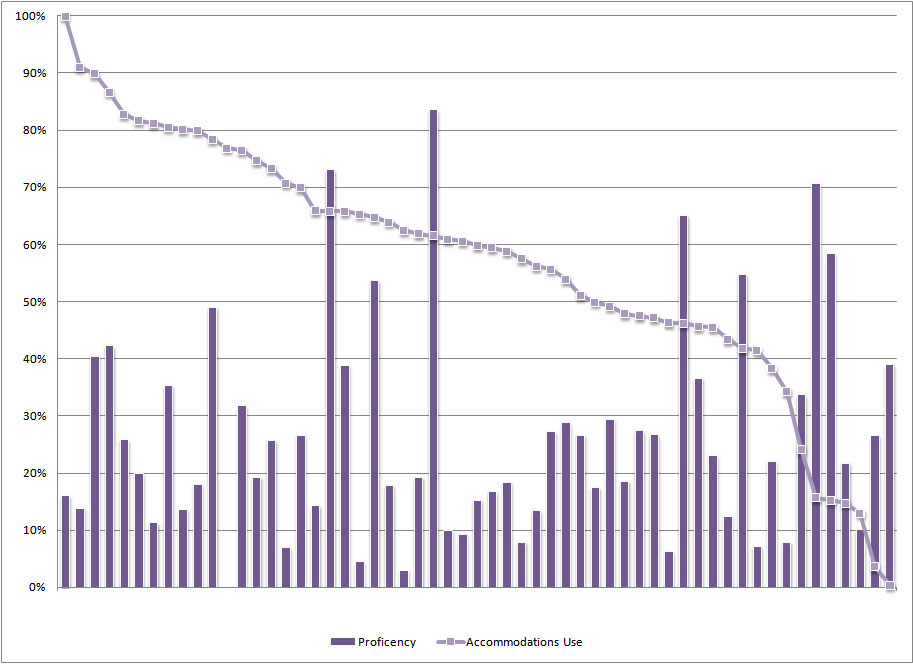
Use of Accommodations and Special Education Proficiency Rates
Figure 3 shows performance of special education students on grade 8 statewide reading regular assessments (in terms of the percentage of students performing at a proficient or above level) along with the percentage of students using accommodations. This figure indicates that there is no evident relationship between the percentage of students using accommodations and performance. This conclusion should be interpreted with caution because it refers only to overall relationships. It does not speak to the performance of individual students who used accommodations.
The same finding was true in unique
states, though they are not included in
Figure 3. State data for unique states
(n = 7) are available in data tables
available at
www.nceo.info/APRsnapshot/data).
Unique state regular assessment
proficiency rates ranged from as low as
2.0 percent to as high as 83.5 percent
while accommodation rates varied. For
example the unique state with the
highest proficiency rate had the lowest
rate of special education students using
accommodations (41.3 percent).
Figure 3. Percentage of Grade 8
Special Education students Scoring
Proficient or Above and Percentage of
Grade 8 Special Education Students Using
Accommodations in 2008-2009 Reading
Regular Assessments
 |
 |
 |
 |
 |
 |
|
Grade 3 |
Grade 4 |
Grade 5 |
Grade 6 |
Grade 7 |
Grade HS |
Click the above images to enlarge for graphs for Grades 3-7 and High School.
Top of page | Table of Contents
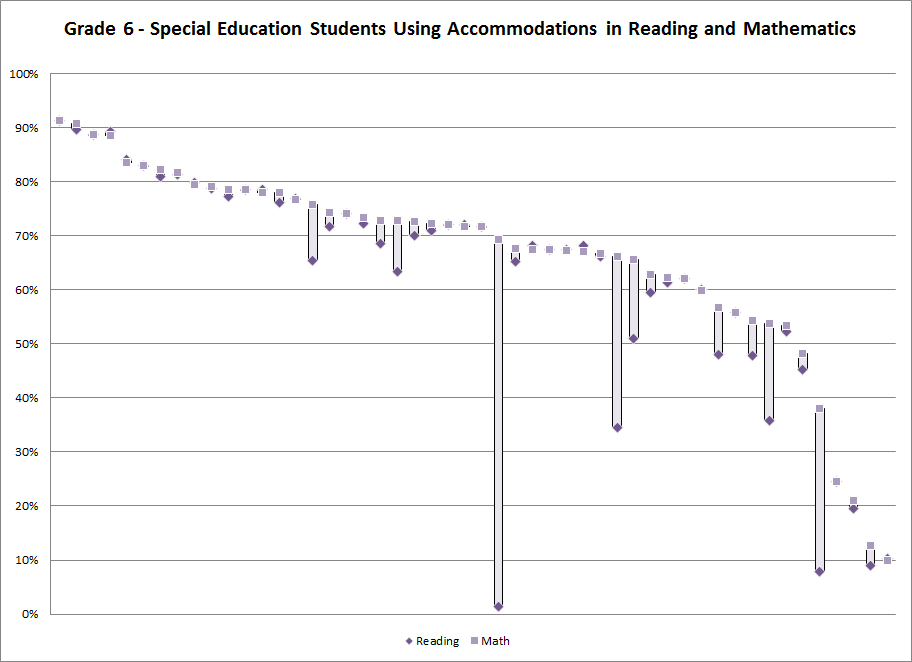
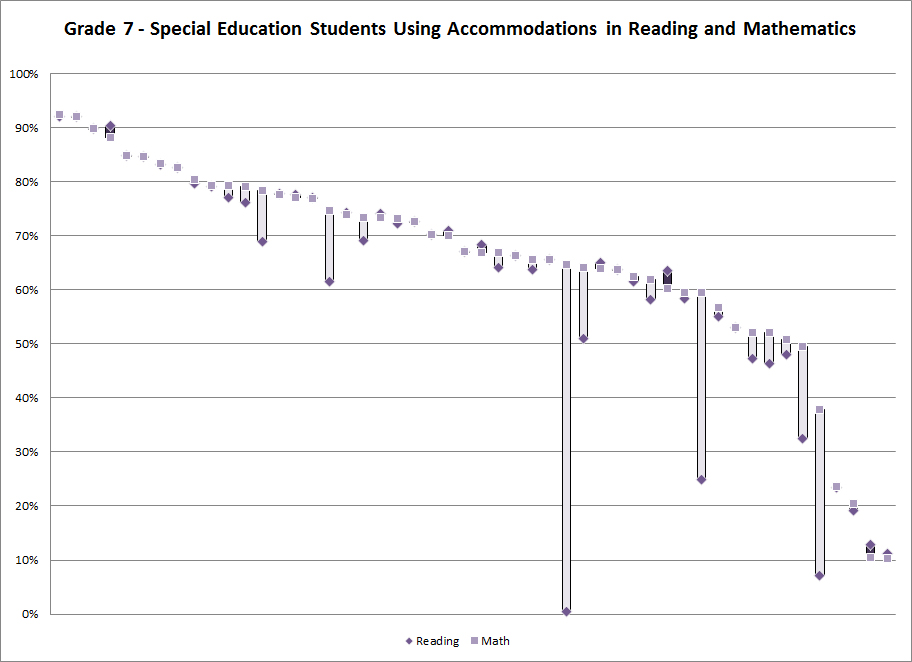
Conclusions
The information presented in this report
summarized the accommodations data
submitted by states to the U.S.
Department of Education for the year
2008-2009. Considerable variability
among states was evident in the
percentage of special education students
using accommodations on the grade 8
reading and mathematics statewide
assessments. Further, in most states
more special education students received
accommodations for the mathematics
assessment than received them for the
reading assessment. Also evident were
differences in many states between the
percentages of students using
accommodations in grade 8 compared to
grade 4, with a slight trend toward a
high percentage of special education
students using one or more
accommodations at the grade 8 level.
Finally, there appeared to be no
relation between the percentage of
special education students using
accommodations and the percentage
proficient on the grade 8 regular
reading assessment.
Top of page | Table of Contents
Resources
Bottsford-Miller, N.A. (2008). A cross-sectional study of reported inconsistency in accommodation use in the classroom and standardized test setting for elementary and middle school students with disabilities. Dissertations Abstracts International, University of Minnesota.
Elliott, S. N., Kratochwill, T. R., McKevitt, B. C., & Malecki, C. K. (2009). The effects and perceived consequences of testing accommodations on math and science performance assessments. School Psychology Quarterly, 24(4), 224-239.
Finch, H., Barton, K., & Meyer, P.
(2009). Differential item functioning
analysis for accommodated versus
nonaccommodated students. Educational
Assessment, 14(1), 38-56.
Cormier, D. C., Altman, J., Shyyan, V.,
& Thurlow, M. L. (2010). A summary of
the research on the effects of test
accommodations; 2007-2008 (Technical
Report 56). Minneapolis, MN: University
of Minnesota, National Center on
Educational Outcomes.
Fletcher, J. M., Francis, D. J., O'Malley, K. Copeland, K., Mehta, P., Caldwell, C. J., Kalinowski, S., Young, V., & Vaughn, S. (2009). Effects of a bundled accommodations package on high-stakes testing for middle school students with reading disabilities. Exceptional Children, 75(4), 447-463.
Lazarus, S. S., Thurlow, M. L., Lail, K. E., & Christensen, L. (2009). A longitudinal analysis of state accommodations policies: Twelve years of change, 1993-2005. Journal of Special Education, 43(2), 67-80.
Lindstrom, J. H. (2010). Mathematics
assessment accommodations: Implications
of differential boost for students with
learning disabilities. Intervention in
School and Clinic, 46(1), 5-12