2008-2009 APR Snapshot #3:
|
 |
 |
 |
 |
 |
 |
 |
|
Grade 3 |
Grade 4 |
Grade 5 |
Grade 6 |
Grade 7 |
Grade 8 |
Grade HS |
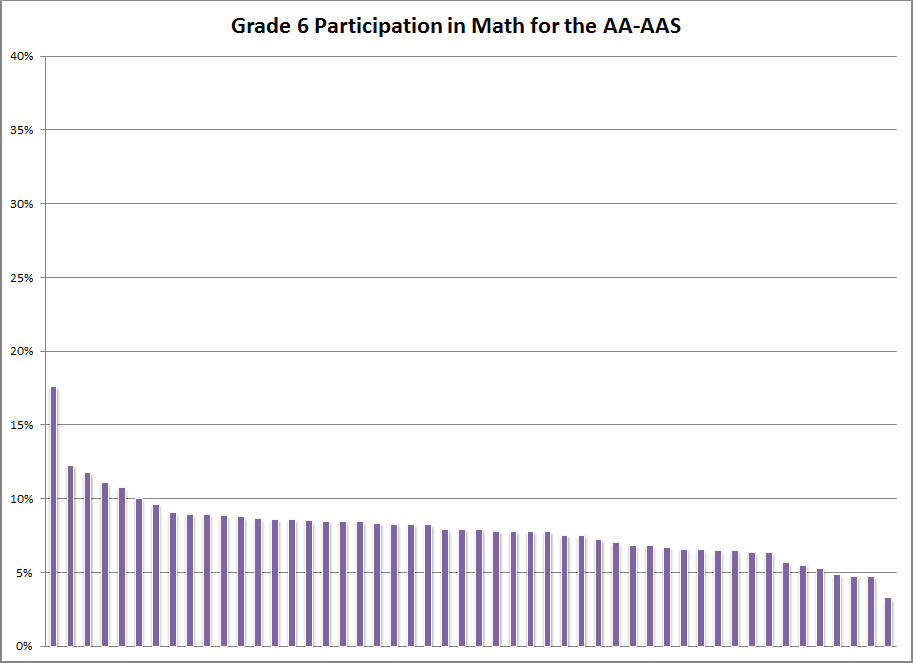
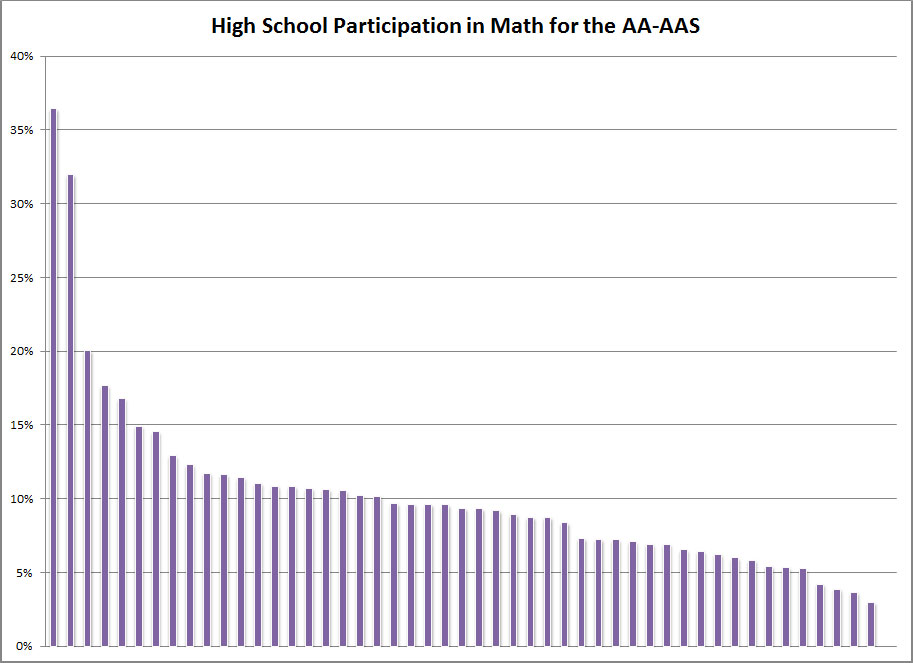
Click the above images to enlarge graphs for Grades 3-8 and High School Mathematics.
 |
 |
 |
 |
 |
 |
 |
|
Grade 3 |
Grade 4 |
Grade 5 |
Grade 6 |
Grade 7 |
Grade 8 |
Grade HS |
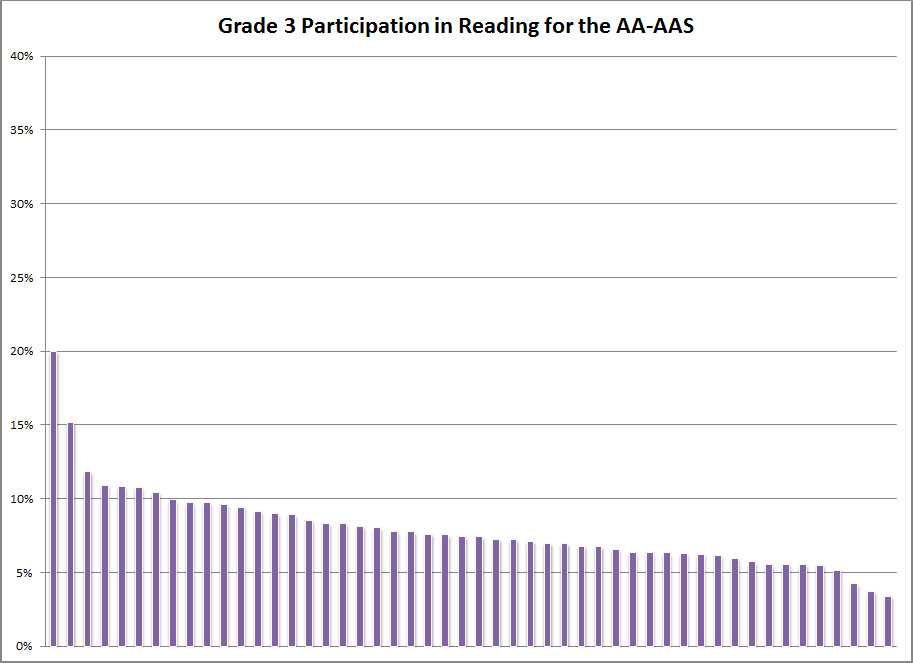
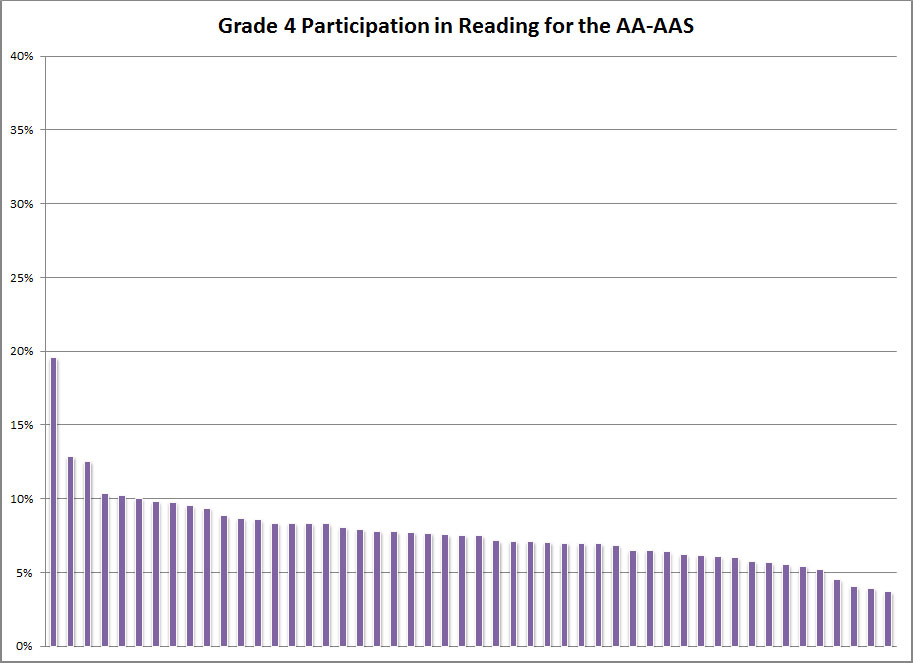
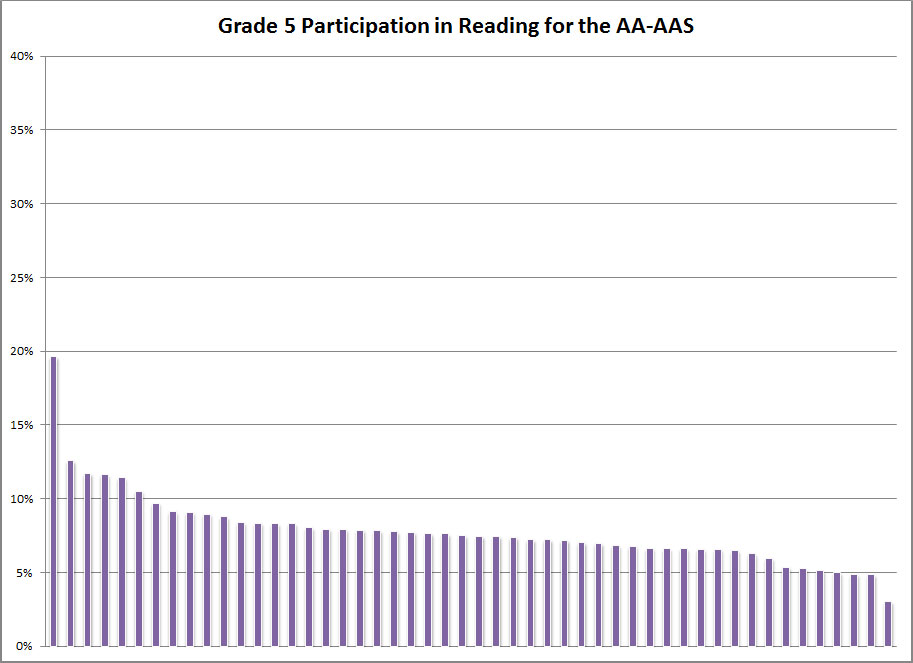
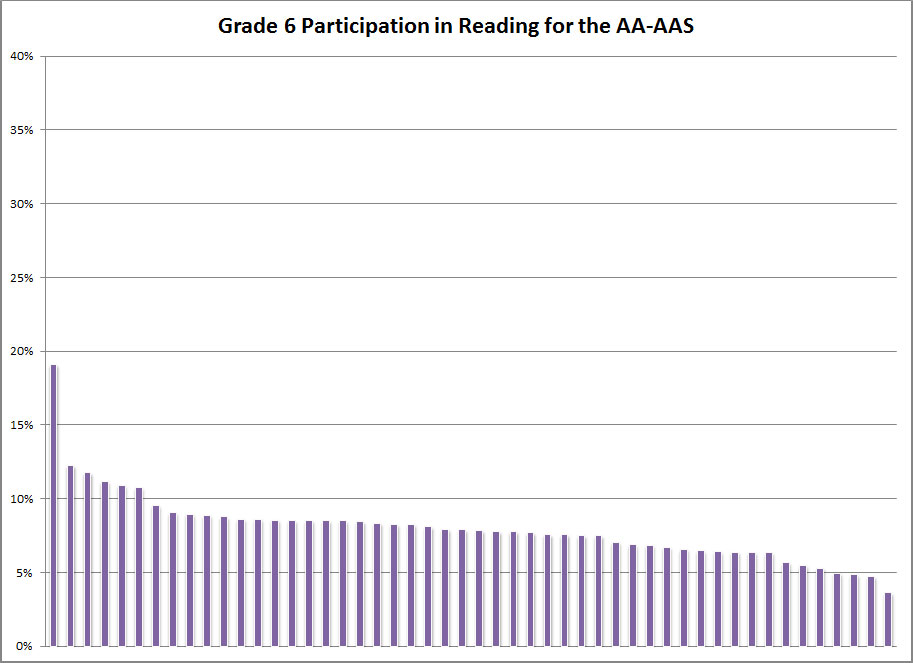
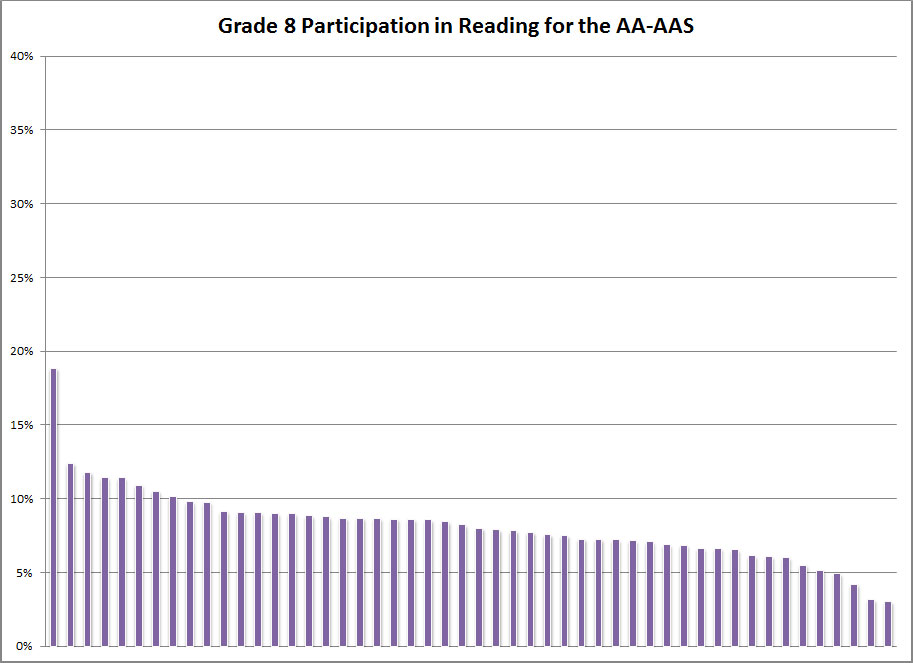
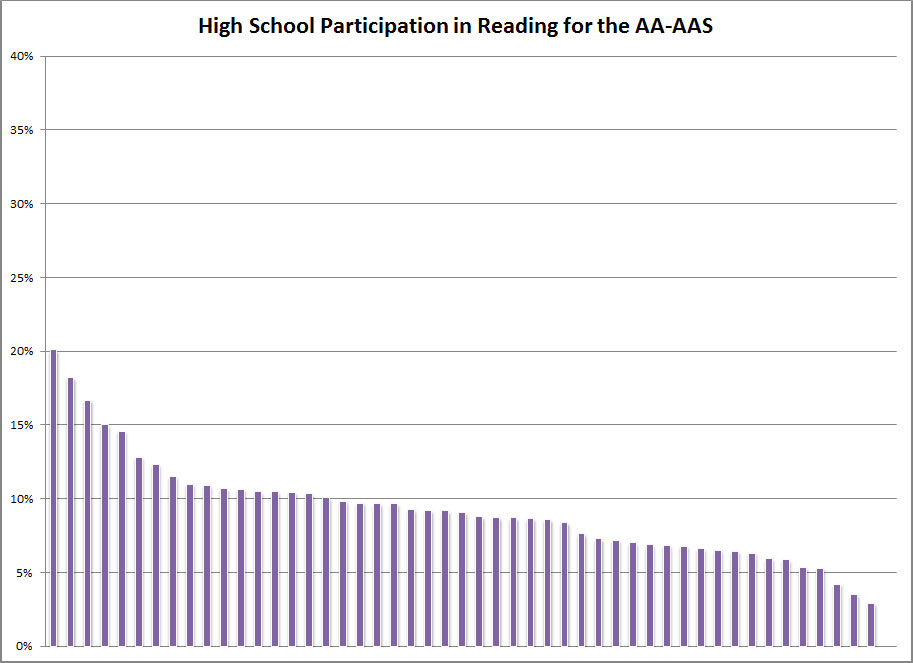
Click the above images to enlarge graphs for Grades 3-8 and High School Reading.
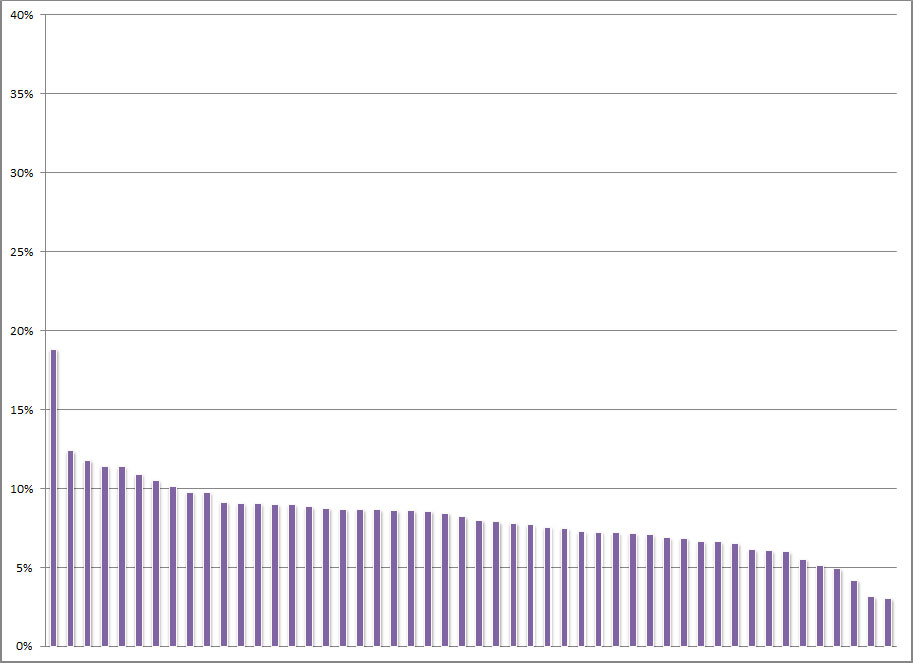
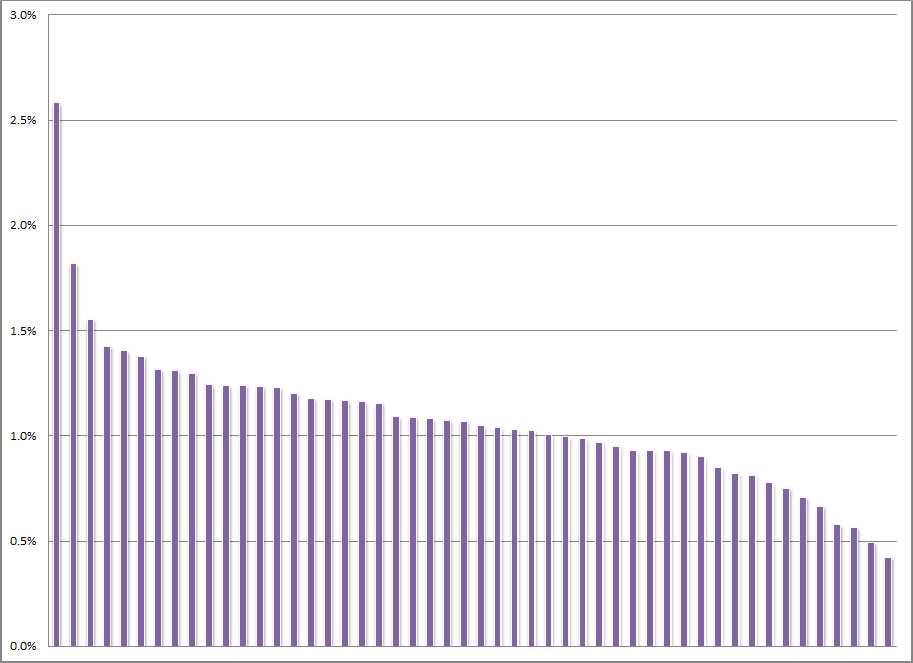
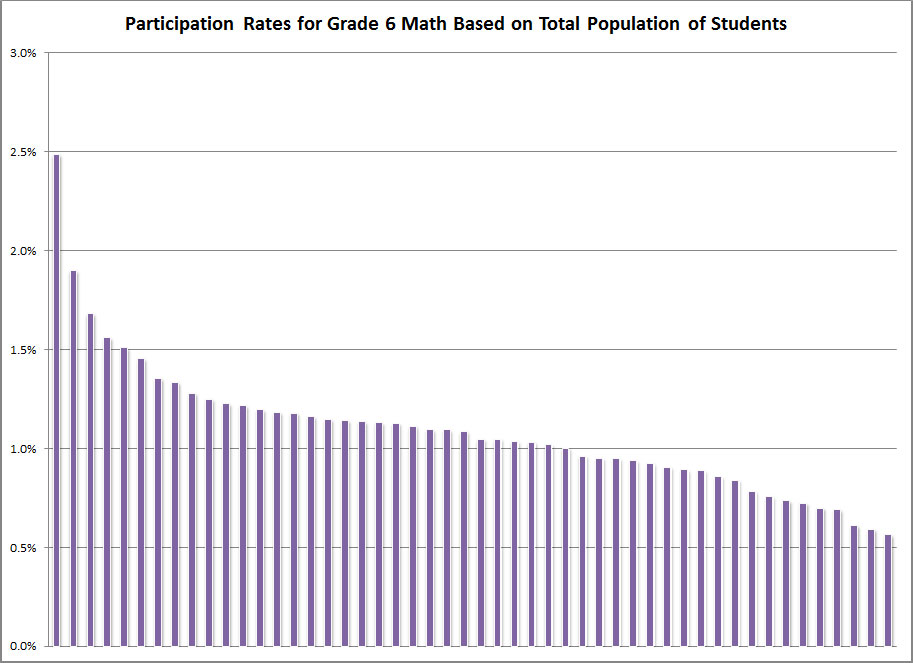
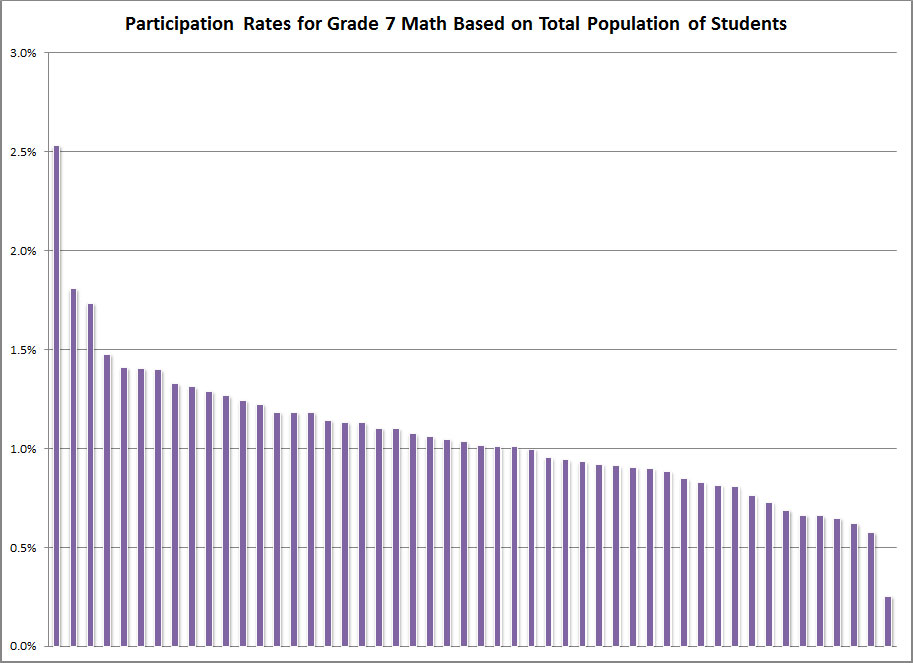
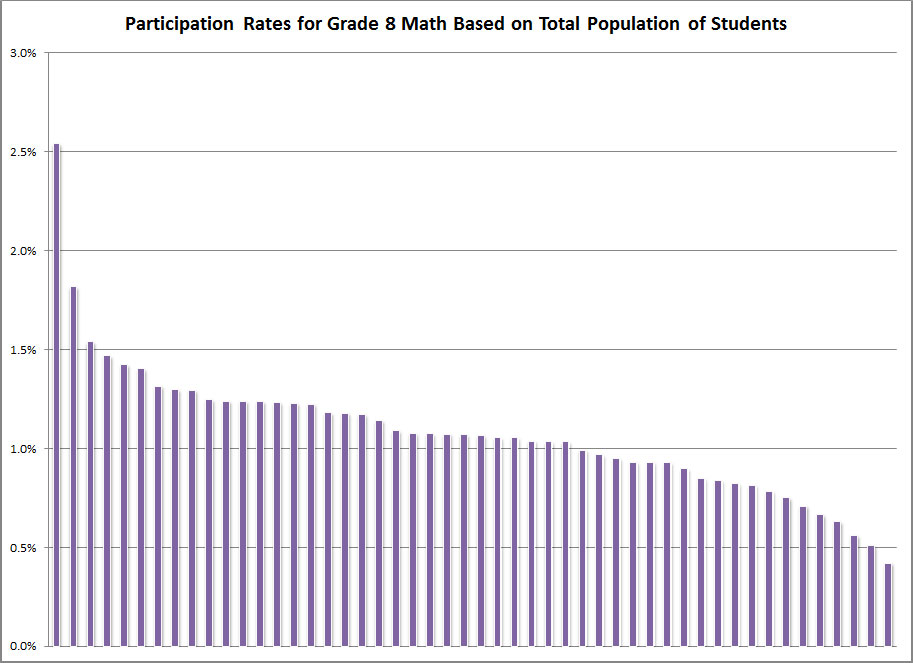
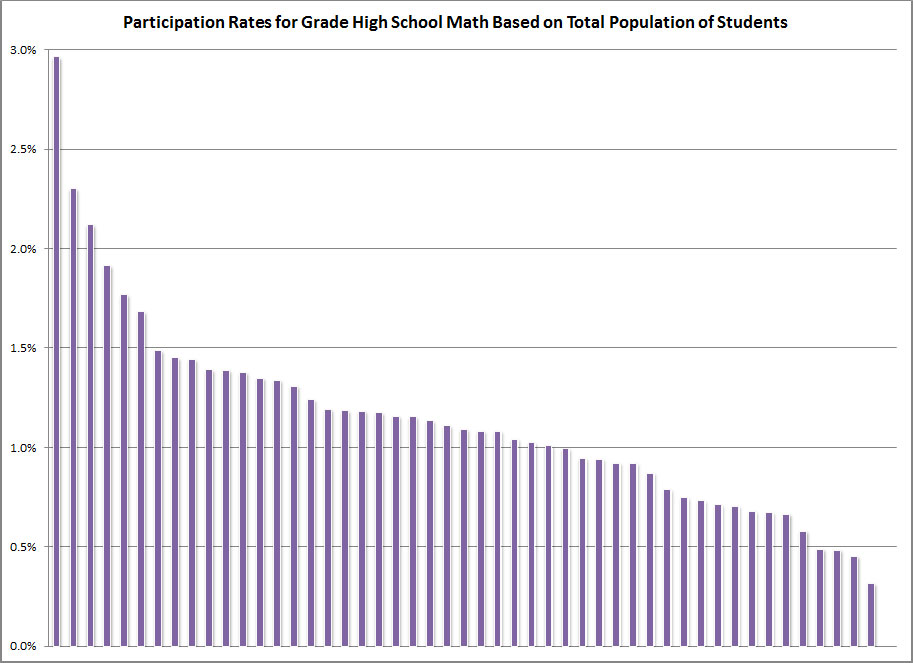
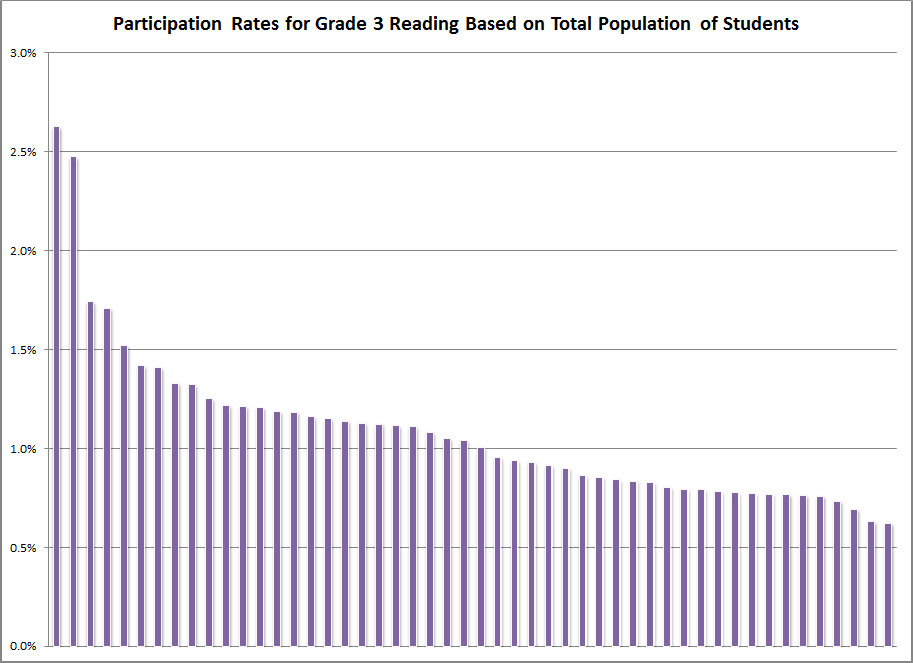
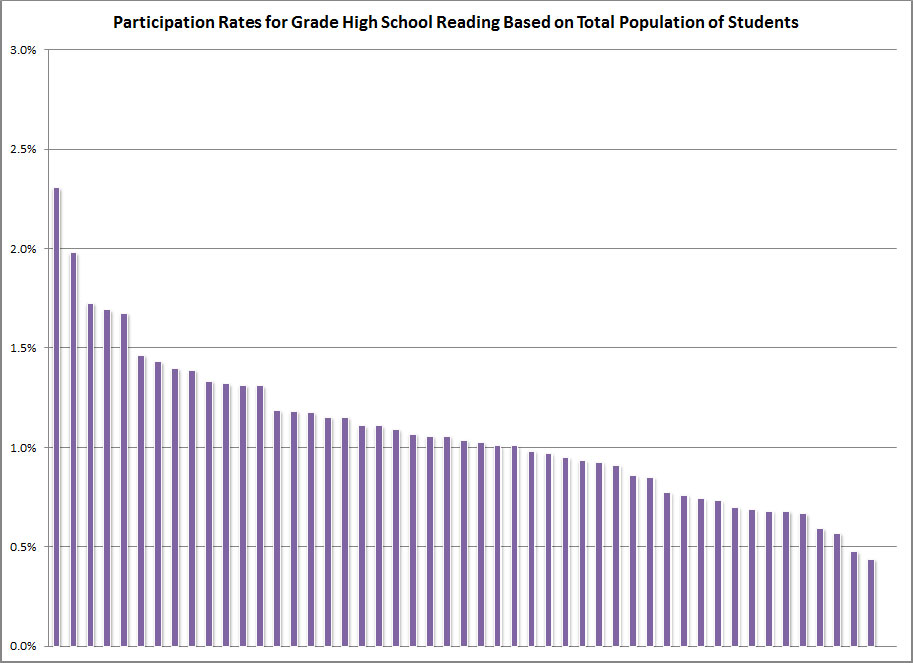
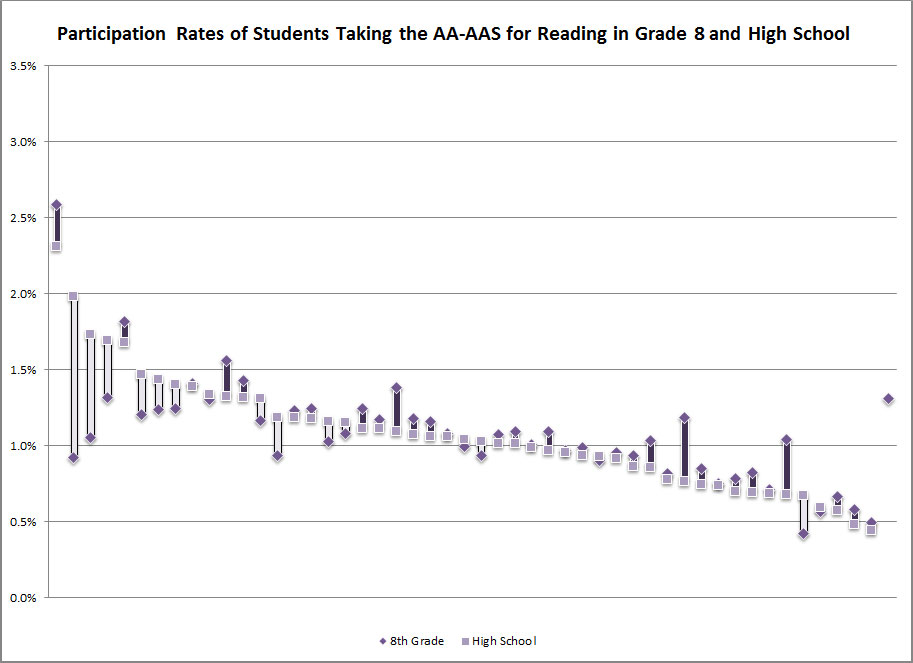
States varied in their rates of students
receiving special education services,
from 10% to 19% of the total student
population, so it is important to look
at participation rates based on the
total student population as well. These
rates for the grade 8 AA-AAS for reading
in all 50 states are presented in Figure
2. States
typically assessed less than two percent
of their total student population
(including both special education
students and non-special education
students) using the AA-AAS for reading.
Similar participation rates existed for
grade 8 AA-AAS for mathematics when
viewed in terms of the total student
population.
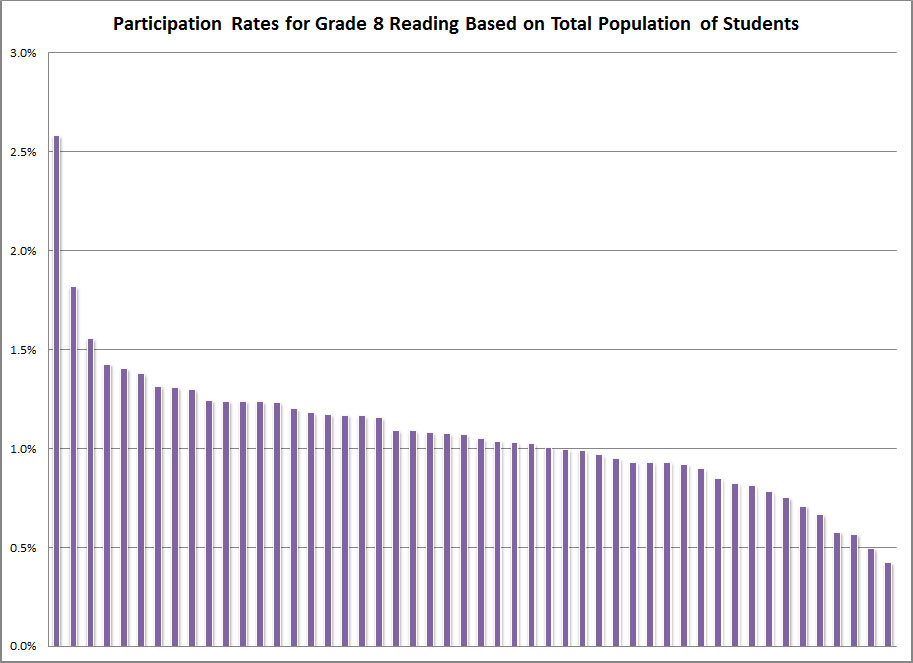
Figure 2. Participation Rates for Grade 8 Reading AA-AAS (Based on All Grade 8 Students)
The
majority of unique states (n = 6)
reported participation rates (based on
total population of students), ranging
from as high as 1.8% to as low as 0.4%.
The unique states are not included in
Figure 2, but are included in data
tables available at
www.nceo/info/APRbriefs/data.
 |
 |
 |
 |
 |
 |
 |
|
Grade 3 |
Grade 4 |
Grade 5 |
Grade 6 |
Grade 7 |
Grade 8 |
Grade HS |
Click the above images to enlarge graphs for Grades 3-8 and High School in Mathematics.
 |
 |
 |
 |
 |
 |
 |
|
Grade 3 |
Grade 4 |
Grade 5 |
Grade 6 |
Grade 7 |
Grade 8 |
Grade HS |
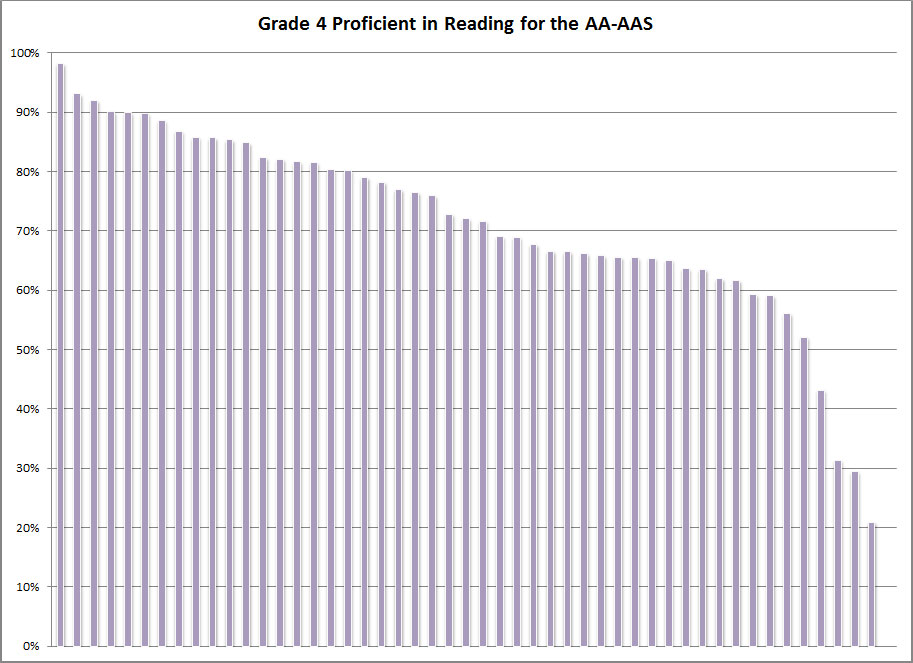
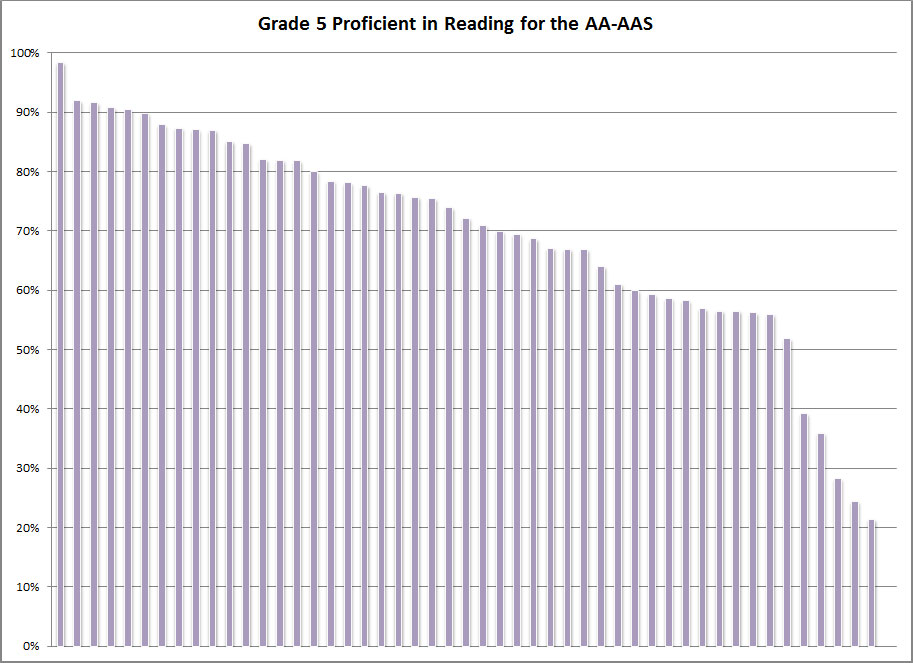
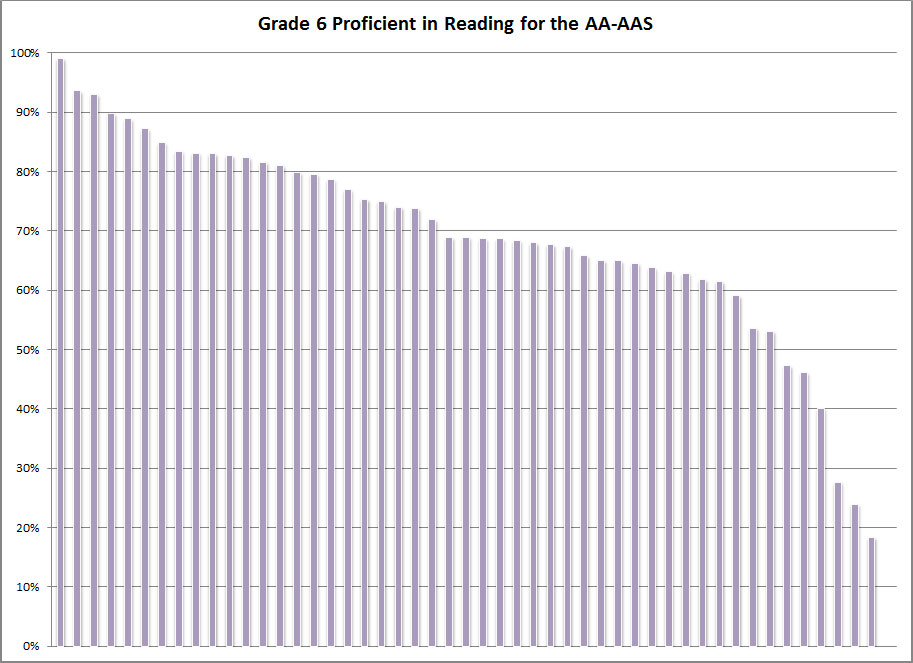
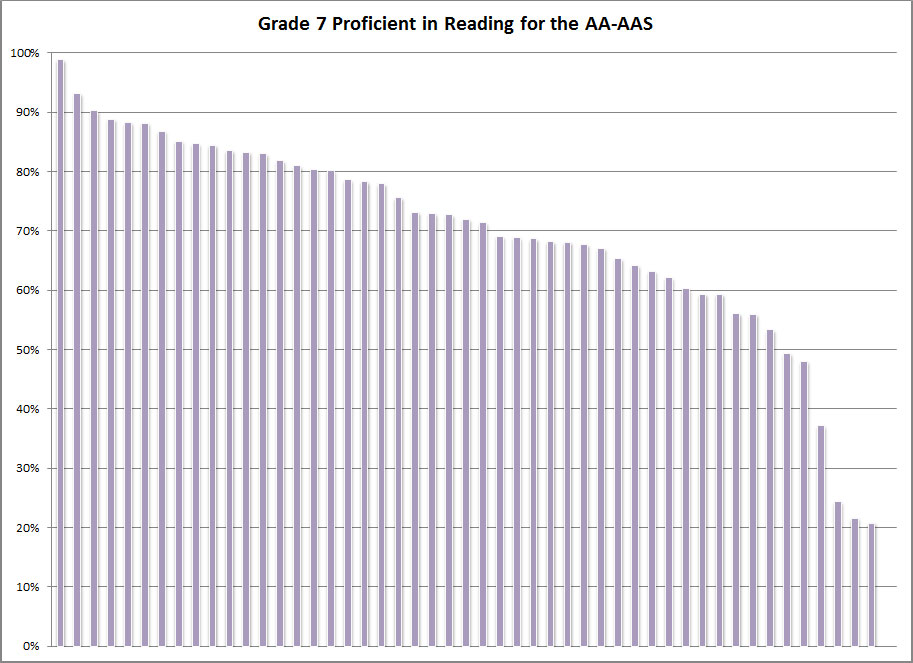
Click the above images to enlarge graphs for Grades 3-8 and High School in Reading.
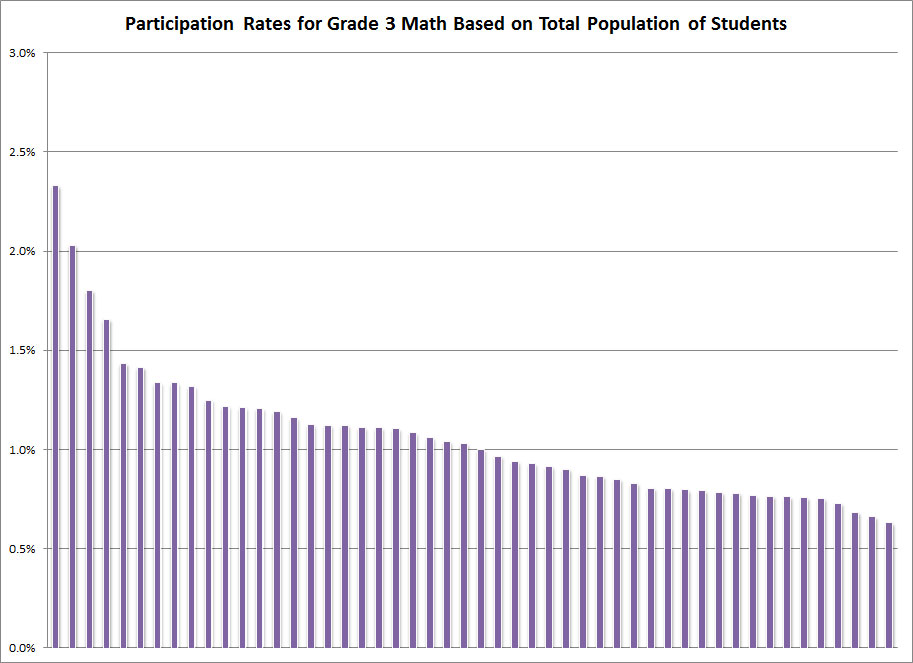
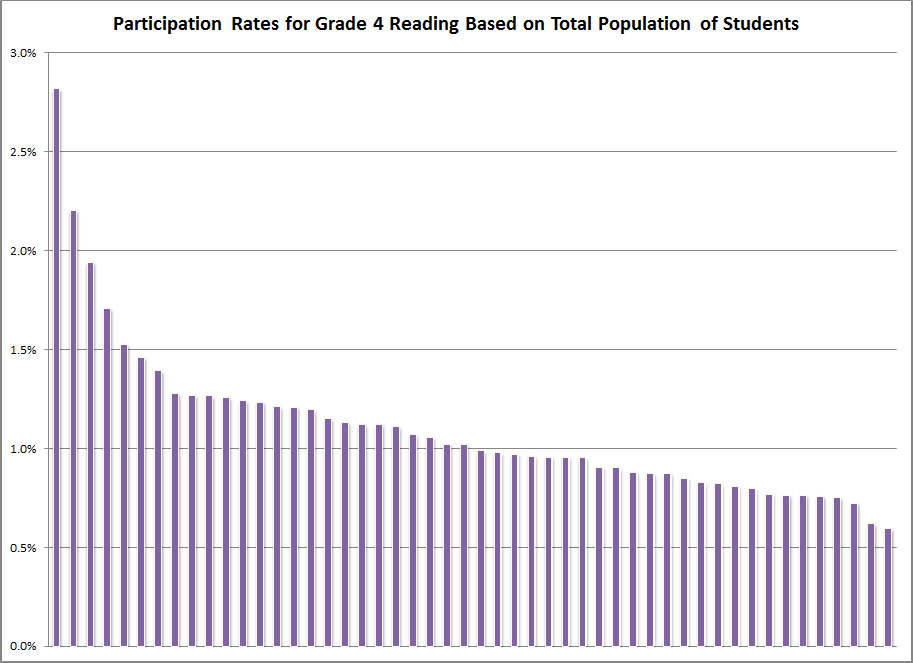
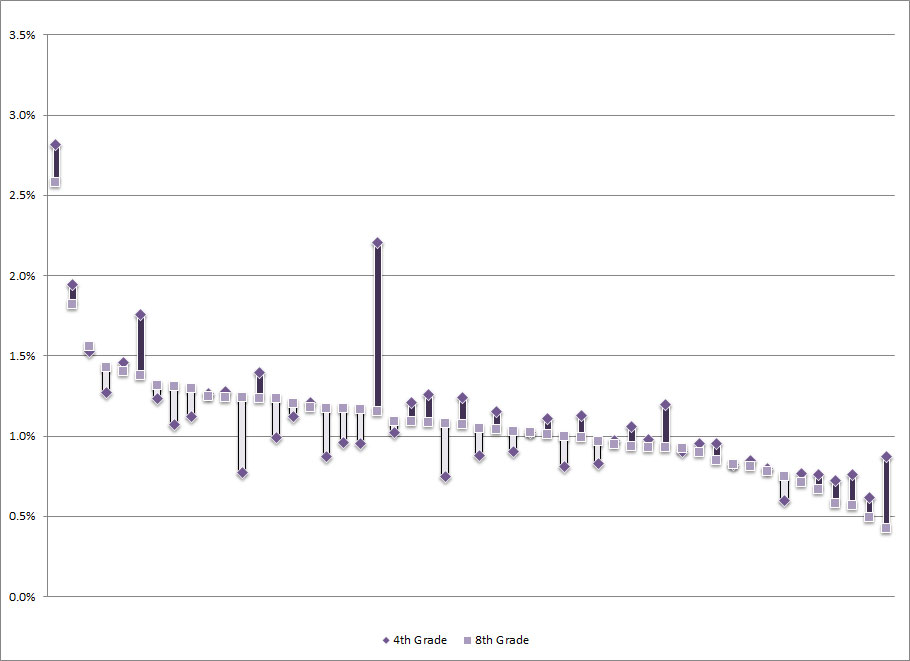
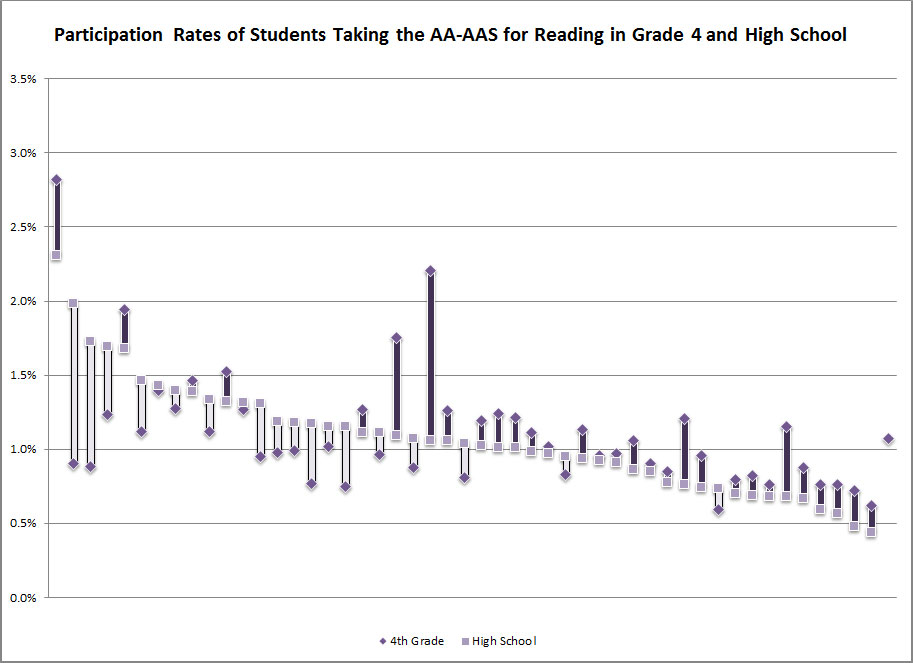
Figure 3
shows reading AA-AAS participation rates
(based on the total population of all
students) for grade 4 and grade 8.
Across all the states, an average of one
percent of the total population of
students participated in the AA-AAS in
each grade. Differences between the two
grades did not show any consistent
trends. Fewer than one-half of the
states (n = 19) reported higher rates in
grade 8 than in grade 4, whereas more
than one-half (n = 29) reported higher
rates in grade 4 than in grade 8. Two
states showed no difference between
grades 4 and 8.
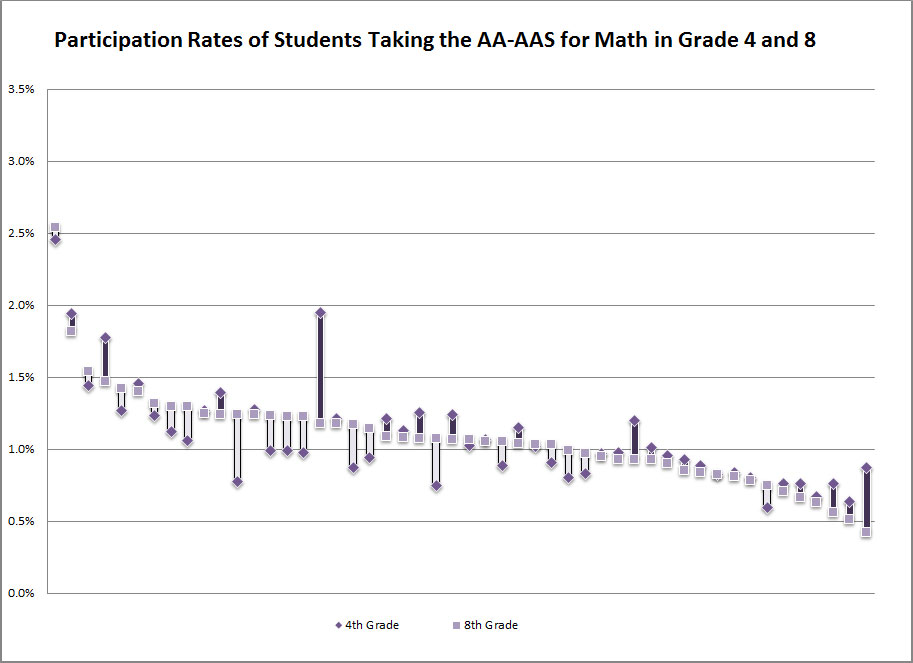
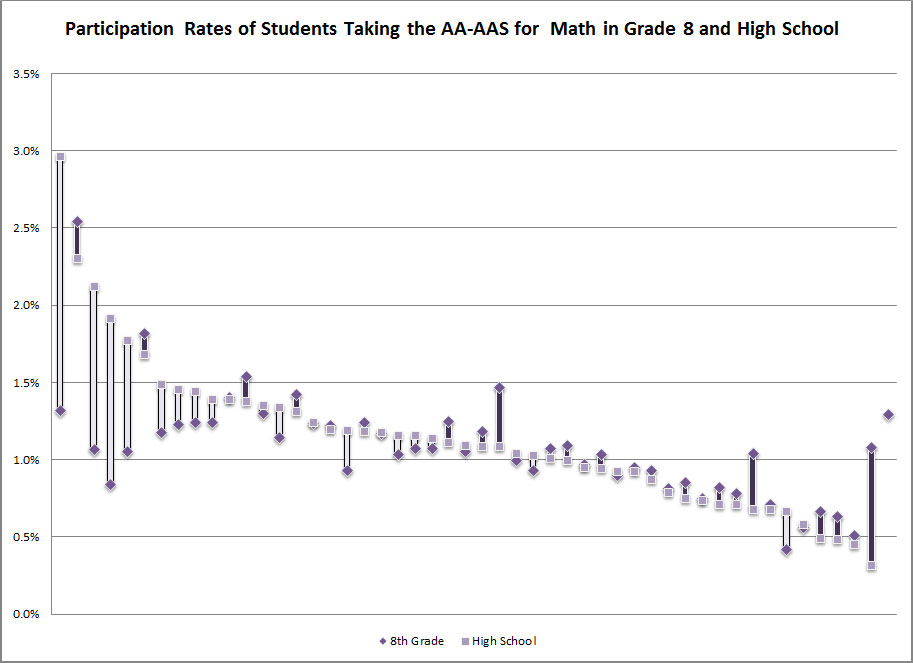
Similar results were found for
the Mathematics AA-AAS.
 |
 |
 |
|
Grade 4 vs 8 |
Grade 4 vs HS |
Grade 8 vs HS |
Click the above images to enlarge graphs in Mathematics.
|
|
 |
 |
|
Grade 4 vs 8 |
Grade 4 vs HS |
Grade 8 vs HS |
Click the above images to enlarge graphs in Reading.
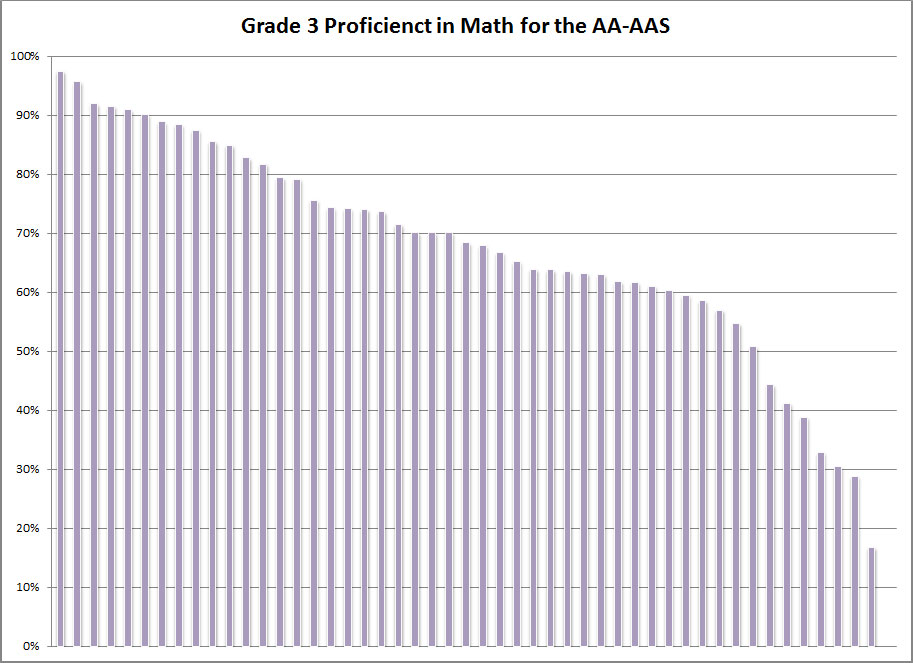
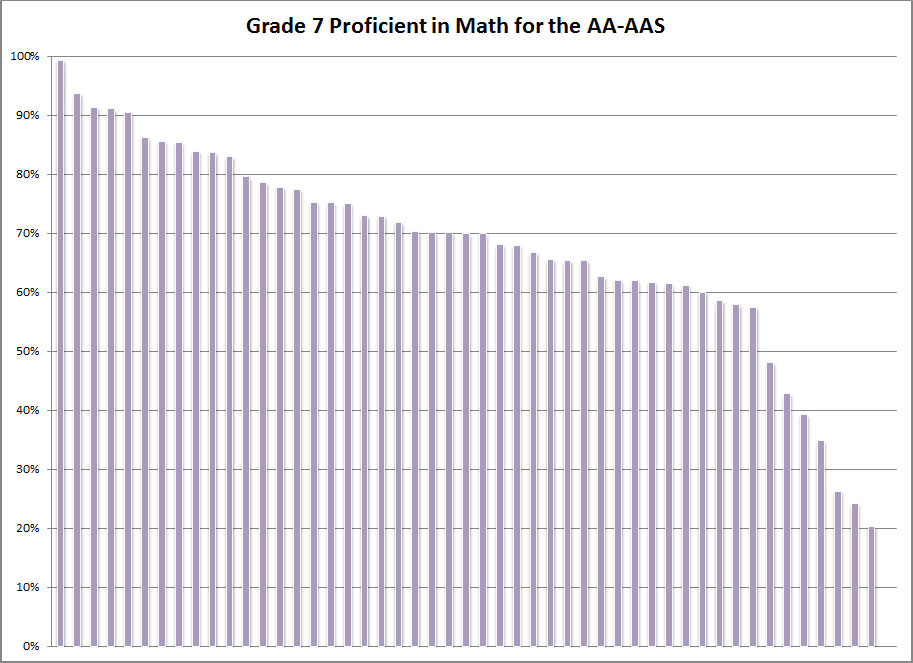
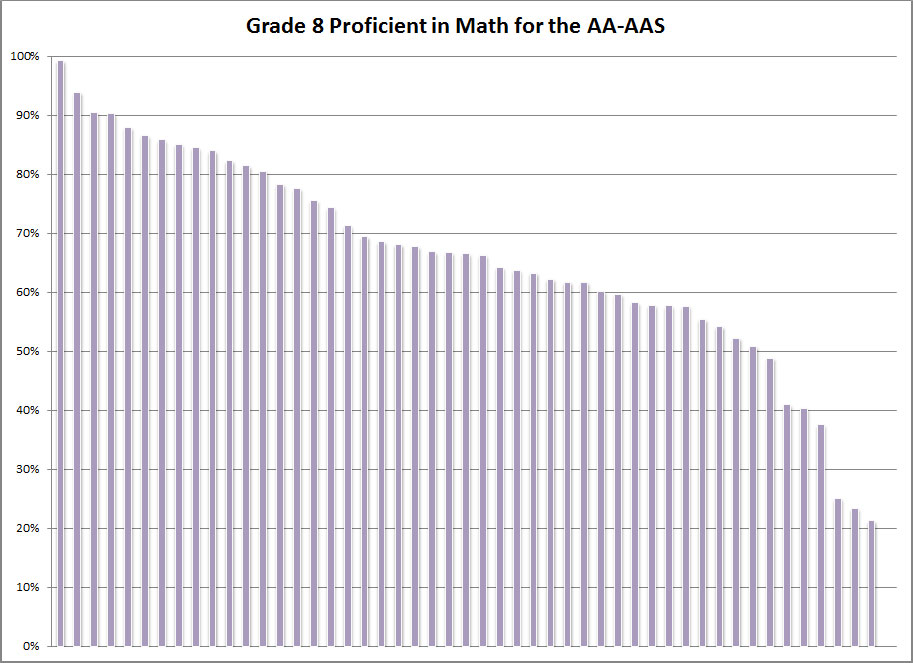
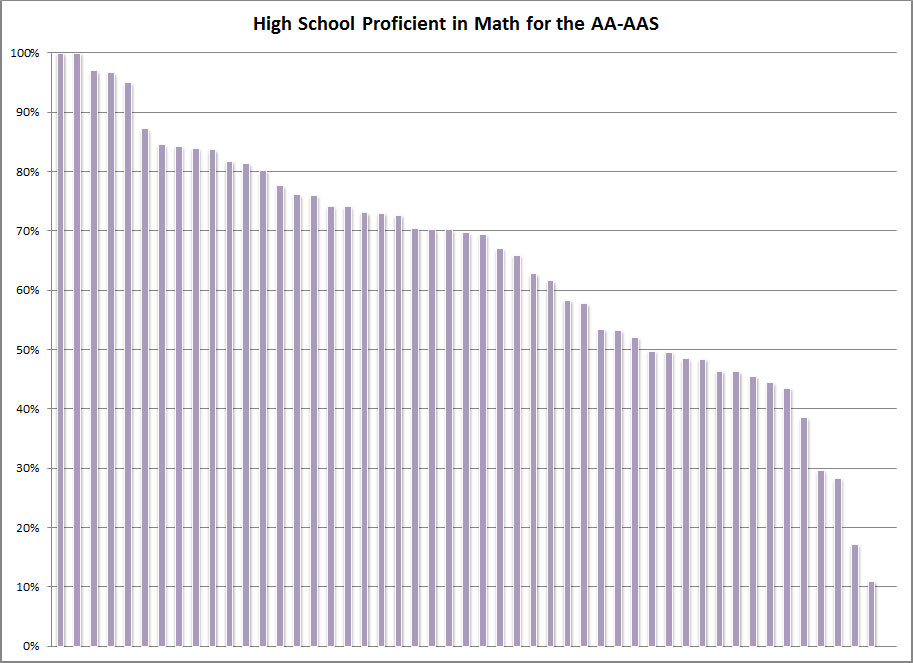
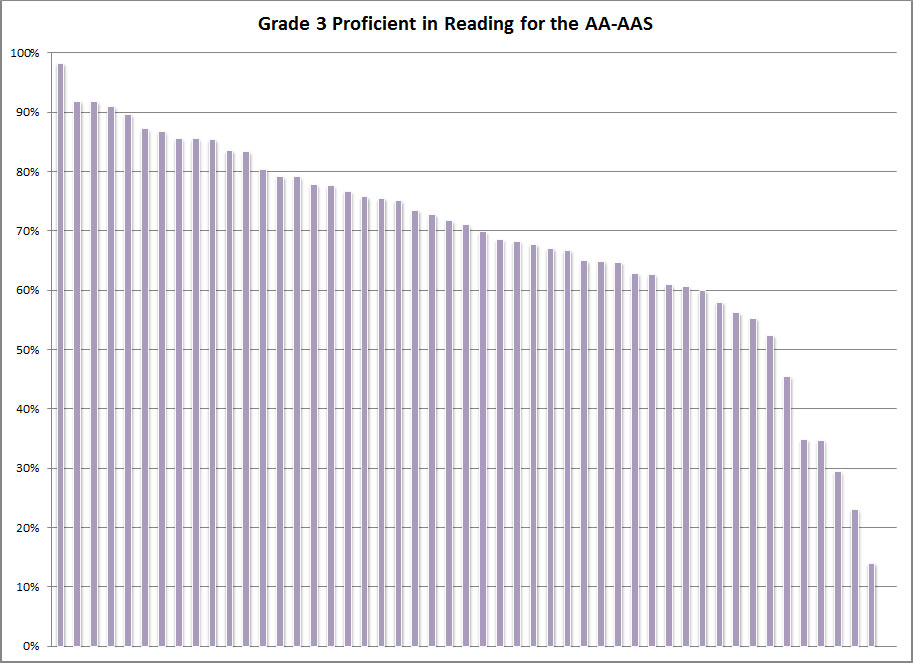
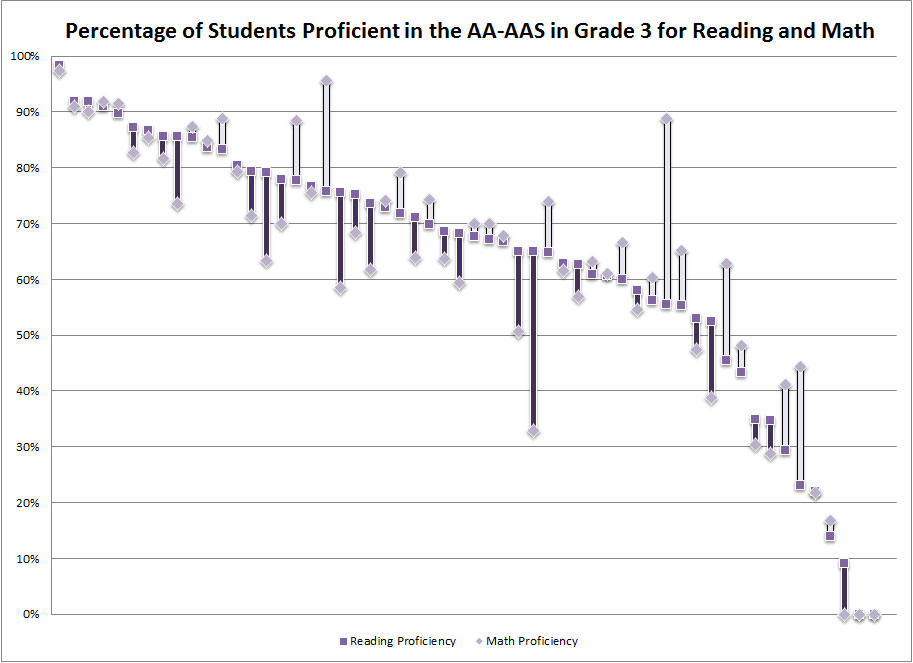
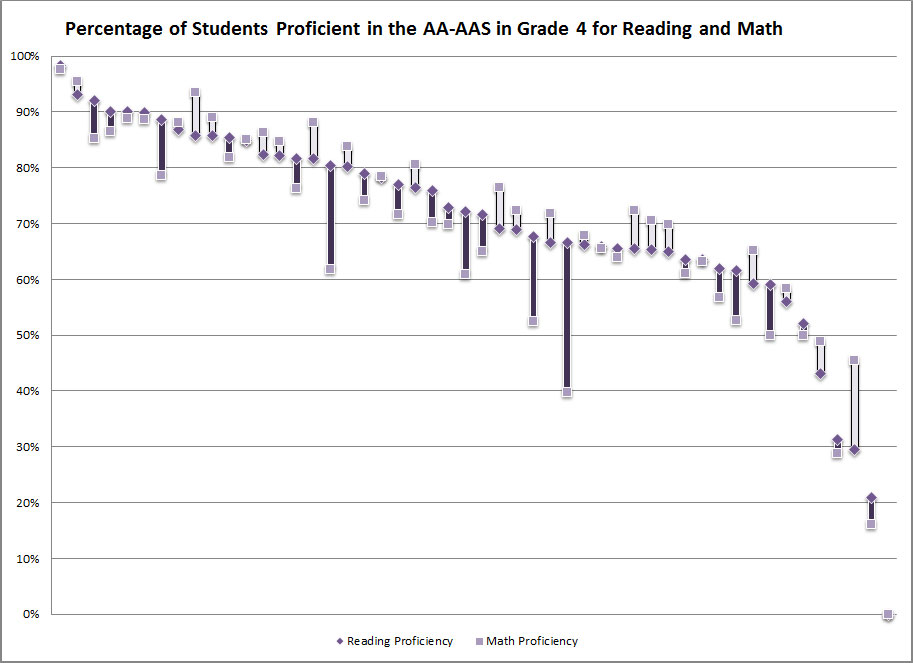
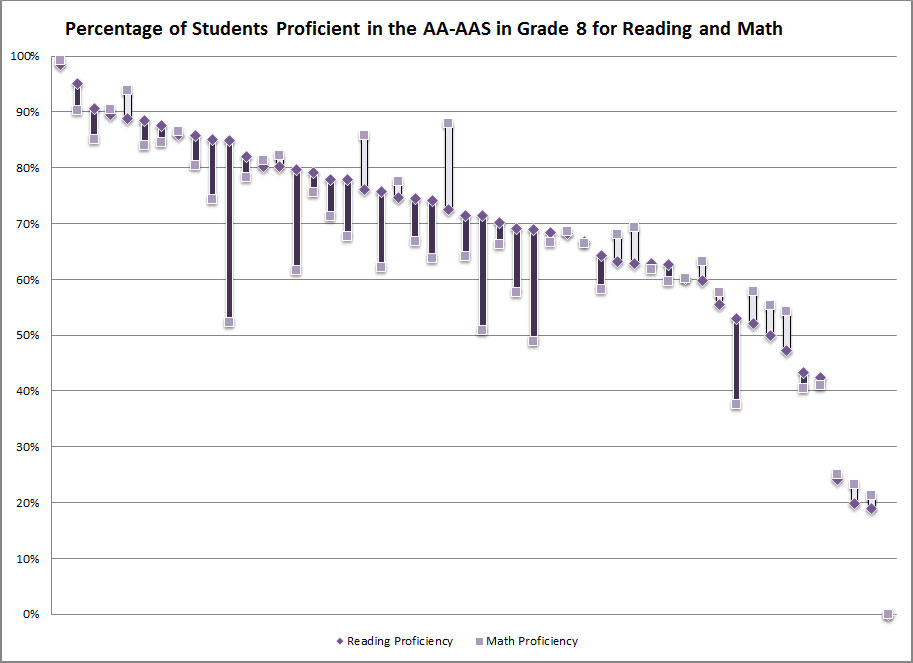
Proficiency
The data here indicate that students
have slightly higher proficiency rates
on the reading AA-AAS (64%) than the
mathematics AA-AAS (61%). As would be
expected with this finding, in addition
to a higher average proficiency rate
across states, the majority of
individual states (n=31) reported higher
proficiency rates in their reading
AA-AAS when compared to that same
state's math AA-AAS. Twenty-three states
had higher rates of proficiency on the
math assessment, and three states did
not report proficiency levels for their
alternative assessment.
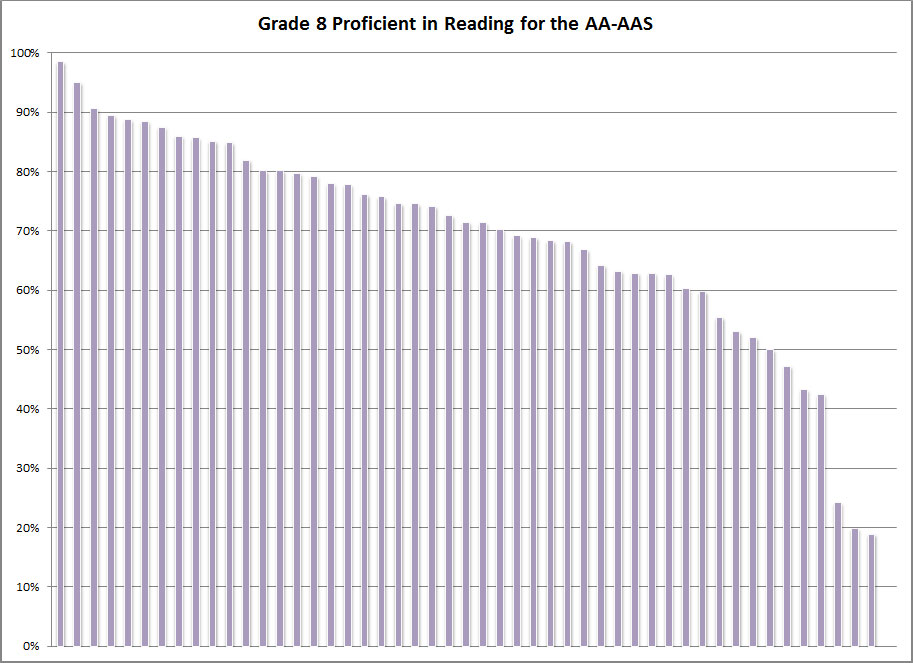
Figure 4. Proficiency Rates for Grade 8
AA-AAS Reading
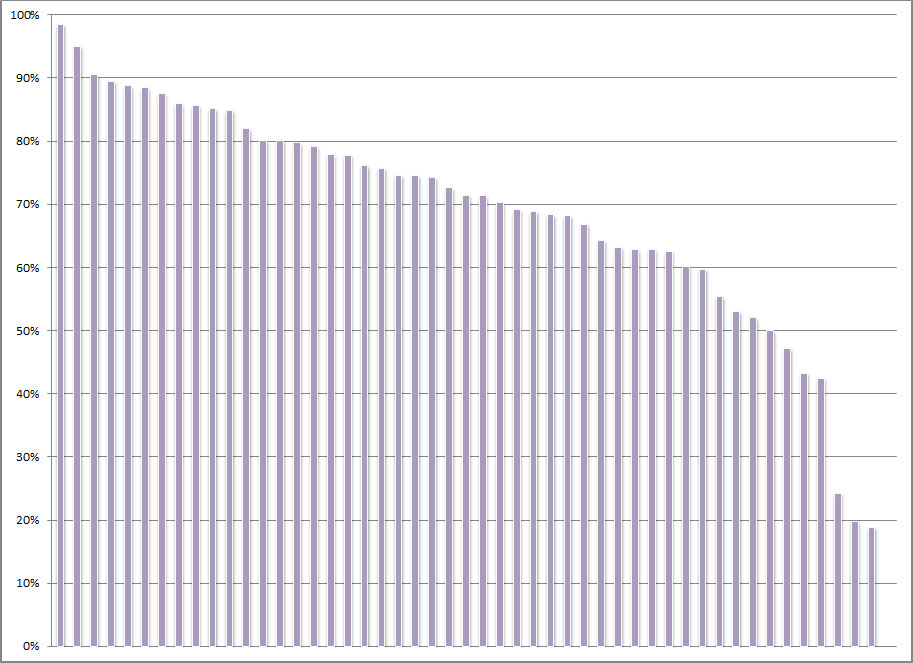
Five of the unique states reported proficiency rates for students in grade 8 for reading and math. In reading, rates of students proficient or above varied from 17.7% to 67.4%, while the rates of students proficient or above in math varied from 22.2% to 61.6%. Proficiency data for the unique states are available at www.nceo/info/APRbriefs/data.
 |
 |
 |
 |
 |
 |
 |
|
Grade 3 |
Grade 4 |
Grade 5 |
Grade 6 |
Grade 7 |
Grade 8 |
Grade HS |
Click the above images to enlarge graphs for Grades 3-8 and High School in Mathematics.
 |
 |
 |
 |
 |
 |
 |
|
Grade 3 |
Grade 4 |
Grade 5 |
Grade 6 |
Grade 7 |
Grade 8 |
Grade HS |
Click the above images to enlarge graphs for Grades 3-8 and High School in Reading.
Figure 5. Proficiency Rates for Grade 8 AA-AAS Reading and Math
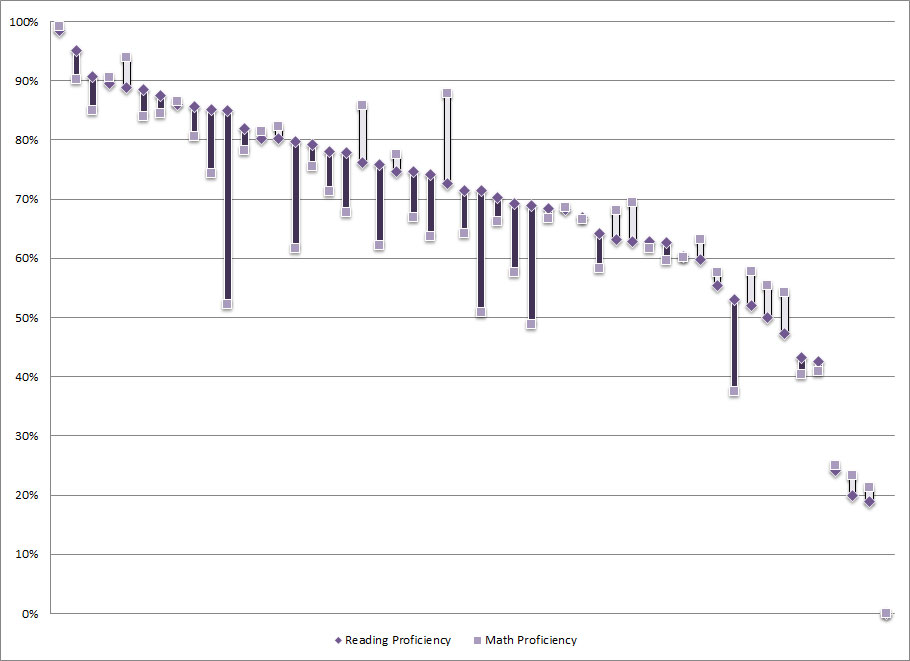
Half of
the unique states (n = 5) reported
proficiency rates for both reading and
math in grade 8. The majority of the
unique states (n = 3) showed a higher
proficiency rate for math compared to
reading. The unique states are not
included in Figure 5, but their data are
available at
www.nceo/info/APRbriefs/data.
 |
 |
 |
 |
 |
 |
 |
|
Grade 3 |
Grade 4 |
Grade 5 |
Grade 6 |
Grade 7 |
Grade 8 |
Grade HS |
Click the above images to enlarge graphs for Grades 3-8 and High School.
Top of page | Table of Contents
Conclusions
The data
presented in this report represent a
snapshot of the participation and
performance of students receiving
special education services who
participate in the Alternate Assessment
based on Alternate Achievement Standards
(AA-AAS). To some extent, variability in
the participation and performance rates
reflects the differences in the states’
AA-AAS themselves, including where the
proficient cuts were set.
The
participation rates described in this
report are fairly consistent across
states, with a few exceptions. This is
generally true regardless of the grade
level or whether the content area is
reading or mathematics. Participation
rates for the AA-AAS tend to be slightly
higher than one percent of the total
population of students (or ten percent
of all students with disabilities). In
addition, the proficiency rate does not
appear to be influenced by the
percentage of students participating in
the AA-AAS. The percentages of students
deemed proficient or above on the AA-AAS
are extremely variable across states,
with a preponderance of states having
quite high rates of students considered
proficient or above. This is true
regardless of grade or content area
assessed, although rates were slightly
higher for reading compared to
mathematics.
According to the U.S. Department of
Education (2007), holding students who
qualify for the AA-AAS to high
expectations greatly increases the
learning opportunities provided to those
students. It is important to keep these
expectations in mind when examining
proficiency rates of students with
significant cognitive disabilities. The
fact that the rates of students
proficient or above on the AA-AAS were
considerably higher than for students
with disabilities in the regular
assessment (see Altman, Vang, & Thurlow,
2012) is a concern, and suggests that
the achievement standards to which
students with significant cognitive
disabilities are held may not be
rigorous enough.
Top of page | Table of Contents
Resources
Altman, J., Vang, M., & Thurlow, M. (2012). 2008-2009 APR snapshot #1: State assessment participation and performance of special education students. Minneapolis, MN: University of Minnesota, National Center on Educational Outcomes.
Quenemoen, R. (2008). A brief history of alternate assessments based on alternate achievement standards (Synthesis Report 68). Minneapolis, MN: University of Minnesota, National Center on Educational Outcomes.
Quenemoen, R., & Thurlow, M. (2007).
Learning opportunities for your child
through alternate assessments.
Washington, DC: U.S. Department of
Education, Office of Special Education
and Rehabilitative Services.
Wakeman,
S., Flowers, C., & Browder, D. (2007).
Aligning alternate assessments to
grade level content standards:
Issues and considerations for alternates
based on alternate achievement standards
(NCEO Policy Directions 19).
Minneapolis, MN: University of
Minnesota, National Center on
Educational Outcomes.